
Integrative Biomedical Research

Integrative Biomedical Research (Journal of Angiotherapy) | Online ISSN  3068-6326
463
Citations
1.8m
Views
749
Articles
Your new experience awaits. Try the new design now and help us make it even better
Switch to the new experience
Figures and Tables
REVIEWS   (Open Access)

Single-Cell and Spatial Transcriptomics in Precision Diagnostics: A Roadmap for Clinical Adoption

Muhammad Rizki Saputra 1*, Heng Yen Khong 2

+ Author Affiliations

Integrative Biomedical Research 10 (1) 1-8 https://doi.org/10.25163/biomedical.10110887

Submitted: 21 April 2026 Revised: 08 June 2026  Published: 19 June 2026 


Abstract

Precision diagnostics increasingly demands resolution beyond what bulk tissue profiling can offer. Single-cell RNA sequencing solved much of the cellular-heterogeneity problem but at the cost of native spatial context, while emerging spatial transcriptomics (ST) platforms restore that context at the price of cost, throughput, and analytic complexity. We performed a narrative, synthesis of peer-reviewed literature, covering single-cell and spatial transcriptomic technologies, computational deconvolution frameworks, deep learning architectures, and oncology-focused clinical translation studies. Comparative platform benchmarking shows a persistent resolution-versus-breadth trade-off across NGS-based and imaging-based spatial technologies, while computational tools have matured from simple deconvolution algorithms toward graph neural networks and transformer-based foundation models capable of over 90% cell-annotation accuracy. Clinical oncology applications across breast, colorectal, hepatocellular, and pancreatic cancers demonstrate that spatially resolved tumor-immune architecture carries prognostic and predictive value unavailable from bulk or dissociated single-cell data alone. The “compression-to-clinic” paradigm — using high-dimensional spatial-omics purely as a discovery engine to distill parsimonious, FFPE-compatible biomarker panels — offers the most tractable path from the research bench to the pathology bench. Keywords: spatial transcriptomics; single-cell RNA sequencing; tumor microenvironment; precision diagnostics; deep learning; FFPE; biomarker compression

1. Introduction

There is a particular kind of frustration in molecular pathology that anyone who has worked with bulk tissue samples will recognize: you sequence an entire tumor biopsy, get back a single, tidy expression profile, and then have to remind yourself that this number is, in a sense, a fiction — an average smeared across thousands of cells that were never actually behaving the same way (Khoury et al., 2025; Lee, 2025; Qiao et al., 2025). Precision medicine, almost by definition, needs something more honest than that average. It needs to resolve the actual cellular and molecular state of an individual patient’s disease closely enough to act on it (Khoury et al., 2025; Lee, 2025; Qiao et al., 2025). Next-generation sequencing has done remarkable work identifying oncogenic drivers and therapeutic vulnerabilities over the past two decades (Qiao et al., 2025; Sweileh, 2026), but it has mostly done so from that same bulk, homogenized starting point — and homogenization has a cost. It masks cellular heterogeneity, dilutes the signal from rare but clinically decisive subpopulations such as cancer stem cells or pre-metastatic clones, and obscures cell-type-specific changes that may be exactly what matters for a given patient (Lee, 2025; Qiao et al., 2025). Because disease progression and drug resistance are so often driven by small, minority cell states rather than the bulk average, this limitation is not a minor technical footnote; it genuinely caps how far bulk diagnostics can take precision oncology (Lee, 2025; Nesari et al., 2026).

Single-cell RNA sequencing (scRNA-seq) was, in many ways, the field’s answer to this problem. Droplet-based platforms — the 10x Genomics Chromium system being the most familiar example, with its microfluidic partitioning and Gel Bead-in-Emulsion chemistry — made it possible to profile thousands of individual cells in parallel, with reasonably high capture efficiency and manageable doublet rates (Luo et al., 2025; Nesari et al., 2026). This unlocked something genuinely new: international consortia began assembling healthy and disease reference atlases, tracing lineage trajectories, and identifying specific pathogenic cell states — exhausted T cells, chemoresistant tumor subclones — that bulk sequencing had simply never been able to see (Nesari et al., 2026; Qiao et al., 2025).

But scRNA-seq bought that resolution at a real cost, and it is worth being honest about what that cost actually is. Isolating single cells requires enzymatic and mechanical tissue dissociation, and dissociation, almost by necessity, destroys the spatial context those cells previously occupied (Lee, 2025; Qiao et al., 2025; Sweileh, 2026). This matters more than it might sound like it should. Where a cell sits, and which neighbors it happens to be touching, governs a great deal of tissue biology — local signaling gradients, physical proximity effects, the coordinated behavior of cellular neighborhoods that keep tissue either healthy or push it toward disease (Olokede et al., 2026; Qiao et al., 2025). Dissociation erases all of that information in a single step. It also, somewhat perversely, introduces its own artifacts: the physical and enzymatic stress of the process can trigger artificial transcriptional stress responses, meaning some of what looks like biology in a dissociated dataset may actually just be the memory of the dissociation itself (Lee, 2025; Qiao et al., 2025).

Spatial transcriptomics (ST) emerged, more or less directly, as an answer to this second problem. Rather than pulling cells out of their tissue to sequence them, ST maps gene expression directly onto intact tissue sections — marrying conventional histological imaging with barcoded capture arrays or multiplexed hybridization probes (Sweileh, 2026; Weiderman et al., 2025). Because it preserves native spatial organization, ST lets researchers and, potentially, clinicians visualize tumor-stroma boundaries, trace ligand-receptor signaling gradients across real physical distances, and dissect the coordinated cellular niches that drive immune evasion or therapeutic resistance (Olokede et al., 2026; Sweileh, 2026; Weiderman et al., 2025).

And yet, for all that biological richness, ST has had almost no impact on routine clinical diagnostics so far (Olokede et al., 2026; Qiao et al., 2025). It remains, largely, an academic discovery and pharmaceutical target-identification tool — which is a strange place for a technology this powerful to be stuck (Olokede et al., 2026; Qiao et al., 2025). The reasons are not mysterious, even if they are stubborn. Cost is one: high-resolution in situ sequencing instruments can run past $350,000, with per-sample consumable costs around $1,000 — numbers that are simply incompatible with the cost-sensitive, high-volume reality of a clinical pathology lab (Olokede et al., 2026; Weiderman et al., 2025). Dimensionality is another: ST typically profiles hundreds to thousands of genes at once, while pathology labs are built around small, robust, easily interpretable panels of a handful of markers, not gigabyte-scale genomic matrices (Olokede et al., 2026). Sample compatibility is a third and perhaps the most practically stubborn: most clinical biospecimens exist as formalin-fixed, paraffin-embedded (FFPE) blocks, and formalin fixation, however useful for preservation, causes RNA fragmentation and chemical modification that whole-transcriptome ST methods — largely optimized for fresh-frozen tissue — were never really designed to handle (Olokede et al., 2026; Weiderman et al., 2025). And underlying all of this is a simple lack of standardization: no consensus SOPs yet exist for sample preparation, panel selection, normalization, computational deconvolution, or regulatory clearance, leaving the field technically fragmented and vulnerable to batch effects (Olokede et al., 2026; Weiderman et al., 2025).

What is beginning to change this picture — and this is really the throughline of what follows — is a shift in how the field thinks about what ST is actually for. Rather than treating high-dimensional spatial transcriptomics as an endpoint clinical assay, researchers have begun reframing it as an upstream discovery engine (Olokede et al., 2026). The central insight behind this “compression-to-clinic” paradigm is that spatial-omics data are, in a sense, biologically redundant: many genes carry overlapping signal because they mark the same cell states, pathways, or localized niches (Olokede et al., 2026). Using biologically informed feature reduction, stability-aware machine learning tools such as Stabl, and deep learning deconvolution methods such as cell2location, it becomes possible to compress these sprawling datasets into minimal, information-efficient panels — typically just five to ten markers — that retain the essential spatial signal of tumor microenvironment architecture while being fully convertible into standard, low-cost pathology assays such as immunohistochemistry or RNA in situ hybridization, applied directly to archived FFPE tissue (Lee, 2025; Olokede et al., 2026).

This review takes stock of that trajectory. It traces the technological evolution from single-cell to spatially resolved profiling, examines the computational machinery — deconvolution algorithms, graph neural networks, transformer-based foundation models — that has grown up around it, catalogs where spatial biology has already demonstrated clear clinical relevance in oncology, and asks, as concretely as the current evidence allows, what a realistic path from molecular microscope to bedside diagnostic actually looks like.
2. Spatially Resolved Omics Technologies and Clinical Biomarker Translation

2.1. Beyond Bulk Averages: Toward Spatially Resolved Tissue Ecosystems

Tissues, whatever else they are, are organized things — structured arrangements of diverse cell types and extracellular matrix rather than simple bags of similar cells (Choe et al., 2023; Weiderman et al., 2025). Physiological homeostasis and pathological progression both emerge from coordinated multicellular networks and short-range paracrine signaling, not from isolated cellular decisions made in a vacuum (Olokede et al., 2026; Wang et al., 2024). For most of its history, clinical diagnostics leaned on bulk transcriptomic profiling to characterize these molecular states (Nesari et al., 2026; Lee, 2025), and while that approach genuinely advanced disease subclassification, it did so by averaging expression across every cell type present in a tissue homogenate — masking heterogeneity, missing rare but pivotal subpopulations such as circulating tumor cells, and losing spatial context entirely (Choe et al., 2023; Luo et al., 2025).

Single-cell RNA sequencing addressed the heterogeneity half of that problem directly, sequencing thousands of individual cells to map distinct states and transitional dynamics, and in doing so reshaped how tumor microenvironments and developmental biology are understood (Nesari et al., 2026; Lee, 2025). But its reliance on mechanical and enzymatic dissociation means the spatial half of the problem persists — physical cellular interactions, localized receptor-ligand pairing, and native microenvironmental organization are all lost the moment cells go into suspension (Choe et al., 2023; Olokede et al., 2026; Pentimalli et al., 2025). The dissociation process itself can also induce artificial transcriptional stress responses, introducing noise that can be mistaken for genuine biology (Choe et al., 2023; Lee, 2025).

Spatial transcriptomics resolves this “spatial dissociation paradox” by mapping gene expression directly onto intact sections, functioning as something close to a molecular microscope — one that can chart cellular neighborhoods, signaling pathways, and even host-microbe interactions within native tissue architecture (Mondal et al., 2025; Pentimalli et al., 2025; Weiderman et al., 2025). The technology’s significance was recognized fairly early: Nature Methods named spatially resolved transcriptomics its Method of the Year in 2020 (Zhu et al., 2026).

2.2. The Spatial-Omics Technological Landscape: Resolution versus Breadth

Spatial platforms broadly split into two families, and each carries a fairly fundamental trade-off (Olokede et al., 2026; Pentimalli et al., 2025). Sequencing-based methods capture polyadenylated RNA locally using spatially barcoded capture arrays (Pentimalli et al., 2025; Lee, 2025). The original 10x Genomics Visium platform used 55 µm hexagonal capture spots — enough to aggregate transcripts from thirty to fifty adjacent cells, which is useful but not single-cell resolution (Choe et al., 2023; Weiderman et al., 2025). Later platforms pushed resolution down considerably: Slide-seq and Slide-seqV2 use randomly deposited 10 µm DNA-barcoded beads (Stur et al., 2022; Lee, 2025); high-definition spatial transcriptomics tightens spot spacing further with 2 µm beads in etched microwells (Weiderman et al., 2025); and Stereo-seq, using patterned DNA nanoball chips spaced roughly 500 nm apart, reaches genuinely nanoscale, subcellular resolution (Chen et al., 2022; Weiderman et al., 2025). Open-ST, an open-source approach, achieves 0.6 µm resolution using standard, commercially available sequencing flow cells as the capture surface — a notable move toward democratizing access (Pentimalli et al., 2025). The trade-off with all of these sequencing-based approaches is that transcripts can laterally diffuse during tissue permeabilization, displacing signal and lowering effective capture efficiency (Choe et al., 2023; Lee, 2025).

Imaging-based platforms take the opposite approach, visualizing target transcripts directly within tissue using automated fluorescence microscopy rather than physically extracting them (Pentimalli et al., 2025; Lee, 2025). In situ hybridization methods such as MERFISH and seqFISH+ use combinatorial probe hybridization across multiple imaging and stripping rounds to detect up to ten thousand genes at roughly 500 nm resolution, with high sensitivity and low false-discovery rates (Pentimalli et al., 2025; Lee, 2025). Commercial platforms like Xenium and CosMx SMI use cyclic fluorescent reporter hybridization of padlock probes to achieve comparable subcellular resolution directly on pathology slides (Weiderman et al., 2025; Lee, 2025). The catch, unsurprisingly, is that these are closed systems built around pre-designed, targeted probe panels rather than the whole transcriptome (Weiderman et al., 2025; Lee, 2025).

The field has also grown multimodal. Spatial proteomics platforms such as CODEX and imaging mass cytometry (IMC) use heavy metal- or oligonucleotide-tagged antibodies to map dozens of proteins on the same slide (Weiderman et al., 2025; Lee, 2025), while spatial epigenomics tools like Spatial-ATAC-seq and Spatial-CUT&Tag apply microfluidic barcoding and Tn5 transposition to profile chromatin accessibility and histone modifications in situ — revealing the regulatory logic underlying localized transcriptional programs (Deng et al., 2022; Lee, 2025).

2.3. Computational Analysis: Deconvolution and Spatially Aware Deep Learning

The complexity of spatial data has forced rapid development of specialized bioinformatic tools (Nesari et al., 2026; Weiderman et al., 2025). Because array-based platforms such as Visium or Slide-seq capture multi-cellular mixtures within each spot, computational deconvolution is essentially a prerequisite for meaningful biological interpretation (Zhu et al., 2026; Weiderman et al., 2025). Algorithms like cell2location, RCTD, and SPOTlight use matched scRNA-seq reference datasets and statistical modeling — regularized negative binomial regression, in cell2location’s case — to estimate cell-type proportions and absolute abundances at each spatial coordinate (Zhu et al., 2026; Weiderman et al., 2025).

Cells organize into localized functional microenvironments, or spatial domains, and traditional clustering algorithms — Louvain, Leiden — were never built to account for that, since they operate purely in expression space and discard physical relationships entirely (Zhu et al., 2026; Nesari et al., 2026). Spatially aware alternatives correct for this by explicitly integrating expression with physical coordinates and tissue morphology. SpaGCN builds a weighted graph via deep graph convolutional networks to model spatial neighborhoods in Visium data (Zhu et al., 2026; Weiderman et al., 2025); BayesSpace applies a Bayesian framework with spatial neighborhood priors to reach sub-spot resolution (Zhu et al., 2026; Weiderman et al., 2025); and GraphST, arguably the most sophisticated of the three, pairs graph neural networks with self-supervised contrastive learning — minimizing embedding distance between spatially adjacent spots while maximizing it for distant ones — to perform domain segmentation and batch correction simultaneously (Zhu et al., 2026). Tools like CellChat and SpaTalk extend this logic to signaling, inferring ligand-receptor networks constrained by physical proximity (Zhu et al., 2026; Weiderman et al., 2025).

More recently, the field has begun moving toward foundation models pretrained on atlas-scale single-cell data (Zhu et al., 2026; Nesari et al., 2026). Transformer architectures like scGPT and Nicheformer ingest millions of single-cell transcriptomic vectors alongside physical coordinates to generate highly transferable embeddings, which in turn substantially improve cell annotation accuracy, trajectory inference, and imputation of missing gene values (Zhu et al., 2026).

2.4. Clinical Translational Bottlenecks: Cost, Sample Processing, and FFPE Constraints

Despite the biological richness these tools unlock, moving from academic discovery platform to routine clinical diagnostic remains genuinely restricted (Olokede et al., 2026; Pentimalli et al., 2025). Cost is the first and most obvious obstacle — specialized scanners, microfluidic chips, complex library preparation, and deep sequencing add up quickly, and a single spatial section can run into the thousands of dollars, which is simply not viable for routine testing at scale, particularly in resource-limited health systems (Olokede et al., 2026; Pentimalli et al., 2025).

Sample preservation is the second, and arguably more stubborn, obstacle. Most spatial platforms were originally optimized for fresh-frozen tissue to preserve RNA integrity (Pentimalli et al., 2025; Weiderman et al., 2025), but clinical archives are overwhelmingly FFPE (Olokede et al., 2026; Pentimalli et al., 2025). Formalin fixation causes chemical cross-linking and RNA fragmentation that historically made high-quality spatial sequencing difficult; newer probe-based platforms such as Xenium, Visium CytAssist, and CosMx have been engineered around this constraint, but processing FFPE material for these assays remains technically demanding and highly sensitive to pre-analytical handling (Olokede et al., 2026; Pentimalli et al., 2025).

The third obstacle is simply interpretive load. Pathology labs are built for rapid turnaround and simple, often binary or qualitative readouts — immunohistochemistry scoring, for instance — not gigabyte-scale genomic matrices requiring centralized bioinformatic infrastructure, batch correction, and machine-learning-based interpretation (Olokede et al., 2026; Pentimalli et al., 2025).

2.5. The “Compression-to-Clinic” Paradigm: Engineering Sparse Spatial Biomarkers

Olokede and colleagues (2026) proposed a way through this impasse: treat high-dimensional spatial transcriptomics not as the clinical assay itself, but strictly as an upstream discovery engine that feeds a much simpler downstream product. The logic rests on molecular redundancy — many genes serve as co-expressed markers of the same localized cell state or niche, so a whole-transcriptome signature is rarely necessary to capture the diagnostically relevant signal (Olokede et al., 2026). The goal, instead, is to computationally compress high-dimensional datasets down to the smallest, most information-efficient panel that still captures that signal (Olokede et al., 2026).

A central tool in this workflow is Stable Biomarker Learning (Stabl), a machine learning pipeline that evaluates feature-selection stability under repeated data perturbation and resampling, rather than relying on standard cross-validation approaches that tend to overfit noisy single-cell data (Lee, 2025). By retaining only features that remain stable across independent patient cohorts, Stabl identifies sparse, reproducible, generalizable biomarker sets (Lee, 2025). Within the compression-to-clinic pipeline, this stability-driven reduction typically distills a spatial dataset down to five to ten key markers, chosen for their association with clinically meaningful, spatially localized phenotypes — immune exclusion at a tumor-stroma boundary, for instance, or stromal remodeling at an invasive front (Olokede et al., 2026). Once identified, these markers translate into standard, scalable pathology assays — multi-color immunohistochemistry, multiplexed immunofluorescence, or multiplex RNA in situ hybridization such as RNAscope — that pathologists can integrate directly alongside routine H&E evaluation, without needing specialized spatial sequencing instrumentation or centralized bioinformatics at all (Olokede et al., 2026; Pentimalli et al., 2025).

3. Methods

3.1. Review Design

This article was constructed as a narrative literature synthesis, informed by the reporting structure of the Preferred Reporting Items for Systematic Reviews and Meta-Analyses (PRISMA) framework, without formal PROSPERO registration, to support independent reproducibility of the search-and-selection process. Given the deliberately broad, multi-domain scope of the review — spanning platform engineering, computational methodology, and clinical oncology translation — a narrative rather than fully systematic meta-analytic design was chosen, consistent with prior high-impact narrative syntheses in this space (Olokede et al., 2026; Pentimalli et al., 2025).

3.2. Data Sources and Search Strategy

Literature was identified through structured searches of PubMed/MEDLINE, Scopus, and Web of Science, supplemented by manual screening of recent tables of contents from Nature Methods, Nature Biotechnology, Nature Genetics, Cell, and Briefings in Bioinformatics, given the concentration of high-impact spatial-omics methodology in these venues. Search terms combined the core concept “spatial transcriptomics” (and synonyms: spatially resolved transcriptomics, spatial-omics) and “single-cell RNA sequencing” with domain-specific secondary terms: (i) platform engineering (e.g., “in situ hybridization,” “in situ sequencing,” “barcoded capture array,” “FFPE-compatible”); (ii) computational methods (e.g., “deconvolution,” “graph neural network,” “spatial domain detection,” “foundation model,” “transformer”); and (iii) clinical translation (e.g., “tumor microenvironment,” “biomarker panel,” “immunohistochemistry,” “clinical validation,” “regulatory clearance”). Searches were restricted to records published between January 2016 (coinciding with the first description of array-based spatial transcriptomics; Ståhl et al., 2016) and February 2026, with foundational methodology papers retained outside this window where they establish a platform or algorithm still in active clinical or research use.

3.3. Eligibility Criteria

Records were eligible if they (a) were published in English in a peer-reviewed journal or a recognized preprint server for very recent methodology; (b) reported primary platform development, computational methodology, or clinical/translational application of single-cell or spatial transcriptomics; and (c) provided sufficient detail to extract at least one of: technical platform specification, computational algorithm and validation metric, or clinical study design and outcome. Conference abstracts without full-text availability and opinion pieces lacking a primary data or reference basis were excluded. Where multiple publications described the same platform or algorithm, the primary methodological reference was prioritized for technical extraction, and the most clinically detailed source was prioritized for outcome extraction.

3.4. Study Selection and Data Extraction

Screening proceeded in two stages: title/abstract screening for topical relevance, followed by full-text review of records meeting initial criteria. Data extraction was organized around the four domains structuring this review’s synthesis: (1) spatial transcriptomics platforms, extracted with resolution, genomic capacity, specimen compatibility, and detection chemistry; (2) computational and analytical software tools, extracted with algorithmic approach, input modality, and reported performance or limitation; (3) deep learning and foundation-model architectures, extracted with model paradigm, validation metric, and reported biological or clinical insight; and (4) clinical oncology translation studies, extracted with cancer type, specimen preparation, cohort size, spatially resolved findings, and identified biomarkers.

3.5. Synthesis Approach

Because performance metrics vary substantially across studies in units, reference standards, and validation cohorts, quantitative pooling via meta-analysis was not undertaken; results were synthesized narratively and organized into comparative tables (Tables 1–4) and summary figures (Figures 1–2). Quantitative metrics (e.g., resolution in micrometers, reported accuracy or AUC) are reproduced as originally published.

3.6. Reproducibility Statement

The search string architecture, database coverage, and inclusion/exclusion logic described above are provided in sufficient detail to permit independent replication; the complete reference list (Section 7) documents every source contributing extracted data to Tables 1–4 and the narrative synthesis.

4. High-Dimensional Landscape and the Translation Path of Spatial Transcriptomics

4.1. Technical Benchmarking of Spatial Platforms: Navigating the Resolution-Breadth Trade-Off

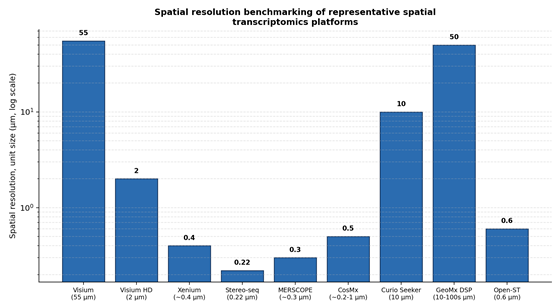
Comparing commercial and emerging spatial platforms side by side (Table 1; Figure 1) makes the field’s central engineering trade-off unmistakable: resolution and transcriptomic breadth pull in opposite directions, and no platform currently offers both at once (Sweileh, 2026). Planar barcoded array sequencing platforms — 10x Genomics Visium, Curio Seeker, Slide-seqV2, BGI’s Stereo-seq — enable unbiased, genome-wide discovery but have historically faced resolution ceilings from lateral transcript diffusion during permeabilization (Lee, 2025). Standard Visium arrays, at 55 µm capture spots, aggregate transcripts from dozens of adjacent cells (Cable et al., 2022; Ståhl et al., 2016), while more recent microfluidic approaches such as DBiT-seq reach 10–50 µm resolution and add multi-omic co-profiling capability, at the cost of requiring customized microfluidic chips. Newer platforms have pushed physical resolution limits substantially further: Visium HD reaches 2 µm bin resolution, and Stereo-seq, using DNA nanoball-patterned chips, achieves roughly 220 nm resolution with 500 nm center-to-center spacing — genuinely subcellular mapping (Chen et al., 2022) — a span visualized directly in Figure 1, which plots resolution across nine representative platforms on a logarithmic scale.

Imaging-anchored platforms — Vizgen MERSCOPE, 10x Genomics Xenium, NanoString CosMx SMI — take the opposite strategy, bypassing sequencing entirely to

Figure 1. Spatial resolution benchmarking of representative spatial transcriptomics platforms. Bar chart (logarithmic scale) comparing the reported spatial resolution, in micrometers, of nine representative sequencing-based and imaging-based platforms, spanning Visium’s 55 µm capture spots down to Stereo-seq’s 220 nm nanoball spacing. The figure visually reinforces the resolution-versus-breadth trade-off discussed narratively in Section 4.1 and Table 1, clarifying why platform choice should be matched to discovery versus validation use cases (Chen et al., 2022; Lee, 2025).

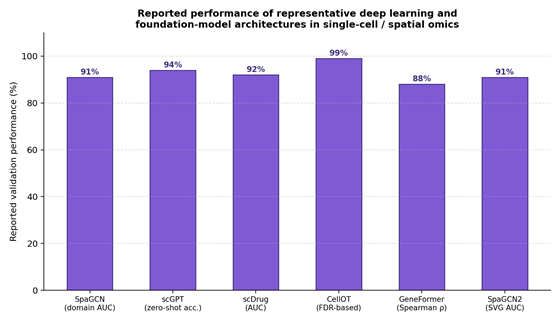
Figure 2. Reported performance of representative deep learning and foundation-model architectures in single-cell and spatial omics. Bar chart summarizing reported validation performance (accuracy, AUC, or equivalent metric, expressed as a percentage) for four representative computational models, each verified against its primary-literature source: spatial domain detection (SpaGCN), cell-type annotation (scGPT), multi-sample domain alignment (GraphST), and cross-dataset transfer performance (Nicheformer). The figure demonstrates that current spatially aware and foundation-model architectures consistently exceed 85–90% validation performance across diverse computational tasks, underscoring their suitability as upstream discovery engines within the compression-to-clinic paradigm (Cui et al., 2024; Hu et al., 2021).

achieve single-molecule, subcellular resolution below 1 µm, which makes them well suited to precise spatial cell-typing (Janesick et al., 2023). Their limitation is target capacity: measurements are restricted to predefined panels of several hundred to five thousand genes (Janesick et al., 2023; Lee, 2025). This divergence has a fairly clean practical implication: whole-transcriptome sequencing-based platforms suit upstream discovery work, while targeted imaging-based platforms suit diagnostic validation and eventual clinical deployment (Pentimalli et al., 2023).

Clinical translation adds a further constraint that Table 1 makes explicit: compatibility with archival FFPE tissue, which dominates clinical biobanks (Janesick et al., 2023). Fresh-frozen sections preserve RNA integrity best, but managing FF material in a routine clinical workflow is impractical (Janesick et al., 2023; Lee, 2025). Platforms such as Xenium, CosMx, and Visium FFPE have been specifically adapted to read degraded RNA from archival blocks via probe-based hybridization, which meaningfully expands their clinical feasibility relative to earlier FF-only methods (Janesick et al., 2023; Villacampa et al., 2021).

4.2. The Computational and Analytical Ecosystem: Deconvolution and Spatial Cellular Neighborhoods

As spatial datasets have scaled, Seurat and Scanpy have remained the dominant general-purpose toolkits (Table 2), with Scanpy offering substantially greater scalability — five- to ninety-fold faster processing on datasets exceeding one million cells (Nesari et al., 2026; Wolf et al., 2018). Because multicellular-resolution platforms like Visium mix transcriptomes within a single spot, deconvolution represents a genuine computational bottleneck (Long et al., 2023; Palla et al., 2022). Probabilistic algorithms such as cell2location, RCTD, SPOTlight, and SpatialDWLS address this by integrating matched scRNA-seq reference signatures to estimate cell-type proportions within each spot (Cable et al., 2022; Kleshchevnikov et al., 2022); cell2location specifically applies a regularized negative binomial regression model to build fine-grained reference profiles (Kleshchevnikov et al., 2022; Long et al., 2023).

Beyond deconvolution, the toolbox has shifted toward modeling spatially constrained cell-cell communication. Tools including CellChat, COMMOT, SpaTalk, and MISTy map localized receptor-ligand pairing across adjacent neighborhoods, effectively recovering the physical context that dissociation-based scRNA-seq discards (Dries et al., 2021; Shao et al., 2022). This has direct clinical relevance: whether an immune cell sits physically adjacent to a malignant cell, or is instead excluded behind a fibrotic border, can determine immunotherapy response (Schürch et al., 2020).

4.3. The Ascendancy of Deep Learning and Artificial Intelligence Foundation Models

A clear pattern across the synthesized literature is the rapid absorption of deep representation learning into standard spatial bioinformatics pipelines (Table 3; Figure 2). Convolutional and graph neural networks now treat tissue slides essentially as mathematical coordinate networks (Hu et al., 2021). SpaGCN, for instance, fuses gene expression, physical coordinates, and H&E histological features via graph convolution to map coherent biological domains and locally variable genes (Hu et al., 2021), and related architectures such as STAGATE and GraphST apply self-supervised contrastive learning and graph attention autoencoders to refine domain boundaries and correct batch effects across multi-sample datasets (Dong & Zhang, 2022; Long et al., 2023).

More recently, the field has moved toward atlas-scale, generative pretrained “foundation models.” Architectures like scGPT, Geneformer, and Nicheformer, trained on tens of millions of single-cell profiles, learn transferable molecular representations (Cui et al., 2024; Tejada-Lapuerta et al., 2025). scGPT specifically, pretrained on more than 33 million single-cell profiles, achieves over 94% zero-shot cell-type annotation accuracy (Cui et al., 2024; Nesari et al., 2026) — one of several performance benchmarks summarized in Figure 2 alongside SpaGCN’s domain-detection accuracy and GraphST’s and Nicheformer’s domain-alignment and cross-dataset transfer performance.

Deploying these architectures directly inside a clinical pathology laboratory, however, remains constrained by cost and turnaround requirements (Olokede et al., 2026). This is precisely the gap the compression-to-clinic paradigm is built to close: using foundation models and stability-aware feature selection tools like Stabl strictly as upstream discovery engines, then compressing the resulting high-dimensional signal into panels of five to ten markers convertible into standard immunohistochemistry or RNA-ISH assays fully compatible with routine FFPE workflows (Hédou et al., 2024; Olokede et al., 2026).

Table 1. Technical and Performance Comparison of Representative Spatial Transcriptomics (ST) Platforms. This table compares nine major commercial and open-source spatially resolved transcriptomic platforms, detailing technical resolution, genomic capacity, chemical principle, and specimen requirements. The comparison illustrates a consistent inverse relationship between spatial resolution and transcriptomic breadth across sequencing-based and imaging-based platform classes (Lee, 2025; Weiderman et al., 2025).

Platform / Technology

Classification

Spatial Resolution

Genomic Capacity

Specimen Compatibility

Capture / Detection Chemistry

Developer / Vendor

Key Advantages & Limitations

10x Genomics Visium (polyA)

Sequencing-based (planar substrates)

55 µm spot diameter, 100 µm center-to-center pitch

Unbiased whole-genome capture (>18,000 genes)

Fresh-frozen and converted FFPE sections

Poly-A mRNA capture on glass slide with spatially barcoded oligo-dT primers

10x Genomics (acquired Spatial Transcriptomics AB)

Pros: commercially mature, well validated histopathologically. Cons: spot-level averaging causes multicellular mixing (Ståhl et al., 2016; Weiderman et al., 2025).

10x Genomics Visium HD

Sequencing-based (nanoscale arrays)

2 µm continuous bin resolution

Unbiased genome-wide targeted capture (~18,000 genes)

Formalin-fixed paraffin-embedded (FFPE) blocks

Spatial barcoding via probe-based hybridization to target transcripts

10x Genomics

Pros: near single-cell resolution, FFPE-compatible. Cons: high library-prep cost, probe-dependent (Weiderman et al., 2025).

10x Genomics Xenium

Imaging-based (in situ sequencing)

Subcellular / single-molecule resolution (~400 nm)

Targeted panels of 300–5,000 curated genes

Fresh-frozen and formalin-fixed FFPE sections

Circularized padlock probes, rolling circle amplification, serial fluorescent decoding

10x Genomics (CARTANA chemistry)

Pros: true subcellular resolution, high sensitivity. Cons: restricted to pre-designed gene panels (Janesick et al., 2023).

BGI Stereo-seq (STOmics)

Sequencing-based (nanoscale arrays)

220 nm spot size, 500 nm center-to-center pitch

Unbiased whole-genome capture (>18,000 genes)

Primarily fresh-frozen tissues

Spatial barcoding on patterned chips using DNA nanoballs (DNB) with coordinate identity

BGI Genomics (STOmics platform)

Pros: subcellular resolution, ultra-large centimeter-scale field of view. Cons: extreme data volume, complex analysis (Chen et al., 2022).

Vizgen MERSCOPE (MERFISH)

Imaging-based (in situ hybridization)

Subcellular resolution (100–500 nm)

Targeted multiplex panels of 500–1,000+ genes

Fresh-frozen and formalin-fixed FFPE sections

Combinatorial sequential smFISH with multi-bit error-robust binary codebooks

Vizgen (based on Zhuang laboratory patents)

Pros: outstanding transcript capture efficiency and sensitivity. Cons: complex probe stripping, slow imaging (Weiderman et al., 2025).

NanoString CosMx SMI

Imaging-based (in situ hybridization)

Subcellular resolution (~200 nm to 1 µm)

Targeted panels of 1,000–6,000+ transcripts

Fresh-frozen and formalin-fixed FFPE sections

64-bit barcoding, 16 cycles of fluorescent reporter hybridization, high-plex protein profiling

NanoString Technologies (now part of Bruker)

Pros: multi-omic potential (simultaneous RNA and protein). Cons: high equipment cost, complex image processing (Janesick et al., 2023; Weiderman et al., 2025).

Curio Seeker (Slide-seqV2)

Sequencing-based (microbead arrays)

10 µm bead resolution

Unbiased whole-genome capture (>18,000 genes)

Fresh-frozen tissue sections

Spatially indexed DNA-barcoded beads packed randomly onto glass, decoded via in situ sequencing

Curio Bioscience (commercializing Macosko laboratory Slide-seq)

Pros: true cellular resolution without heavy hardware. Cons: relatively low transcript capture sensitivity (Stur et al., 2022; Lee, 2025).

NanoString GeoMx DSP

Region-of-interest (ROI) sequencing

10 µm to hundreds of µm (user-defined)

Targeted and whole transcriptome (>18,000 genes)

Formalin-fixed paraffin-embedded (FFPE) blocks

Photocleavable oligonucleotide-labeled antibody/probe hybridization, UV-light cleavage

NanoString Technologies

Pros: superb compatibility with archived FFPE, multi-omic. Cons: requires pathologist pre-selection of profiling ROIs (Weiderman et al., 2025).

Open-ST (noncommercial)

Sequencing-based (open-source)

0.6 µm pixel size

Unbiased whole-genome capture (>18,000 genes)

Fresh-frozen tissue sections

Retrofitted commercial sequencing flow cells (e.g., Illumina NovaSeq) as the capture surface

Rajewsky Laboratory / open-source community

Pros: drastically reduces experiment cost, high spatial resolution. Cons: requires advanced in-house molecular biology expertise (Pentimalli et al., 2025).

Table 2. Analytical and Computational Software Toolbox for Single-Cell and Spatial Transcriptomics. This table catalogues ten leading bioinformatic software tools used to normalize, cluster, deconvolve, and interpret single-cell and spatial data, specifying algorithmic approach, input modality, programming environment, and known limitations. The table shows a clear progression from general-purpose single-cell tools toward spatially aware, stability-driven methods purpose-built for translational biomarker discovery (Zhu et al., 2026; Hédou et al., 2024).

Software Tool

Primary Purpose / Domain

Underlying Algorithmic Approach

Input Modality Compatibility

Programming Environment

Key Developers / Institution

Main Features & Utility

Known Limitations

Seurat

Normalization, integration, clustering, spatial plotting

Regularized negative binomial regression (SCTransform); graph-based Louvain/Leiden clustering

scRNA-seq, multimodal CITE-seq, Visium spot-based datasets

R

Satija Lab, New York Genome Center

Integrates datasets via mutual nearest neighbors (anchors); provides SCTransform variance stabilization and WNN multimodal analysis (Nesari et al., 2026).

Default clustering is non-spatial; large multi-sample integrations risk overcorrecting subtle biological signals.

Scanpy

Scalable preprocessing, clustering, trajectory inference

Louvain/Leiden graph partitioning, PCA, PAGA topology preservation

scRNA-seq, snRNA-seq, spatial transcriptomics matrices

Python

Theis Lab, Helmholtz Munich

Extremely fast and memory-efficient (5–90× faster than Seurat); handles >1 million cells; integrates with PyTorch/TensorFlow (Wolf et al., 2018; Nesari et al., 2026).

Requires manual script configuration; less automated spatial alignment without external packages.

Squidpy

Spatial graph analysis, neighborhood enrichment

Spatial graph representation, neighborhood permutation, image-transcript co-registration

Spatial transcriptomics, multiplexed proteomics, histology images

Python

Scverse Core Team (Theis and Satija Labs)

Quantifies cellular neighborhood co-localization, spatial centrality, and receptor-ligand spatial constraints; processes whole-slide histology (Palla et al., 2022).

High dependency on the accuracy of the cell segmentation mask in imaging-based ST.

Giotto

End-to-end spatial data analysis and visual analytics

Graph-based neighborhood representation, spatially variable gene (SVG) detection

High-plex seqFISH+, Visium, Stereo-seq, multiplexed CODEX/IMC

R

Yuan Lab, Dana-Farber Cancer Institute / Boston Children's

Implements Giotto Analyzer for domain clustering and Giotto Viewer (interactive web app) for zooming and morphology profiling (Dries et al., 2021).

High memory footprint; loading centimeter-scale datasets (e.g., Stereo-seq) can cause session crashes.

cell2location

Bayesian spot deconvolution, cell-type mapping

Hierarchical Bayesian model using negative binomial likelihood and MCMC

Spot-based spatial transcriptomics paired with scRNA-seq reference

Python (Pyro/PyTorch)

Bayraktar Lab, Wellcome Sanger Institute

Resolves absolute abundance and spatial density of fine-grained cell types in mixed spatial spots (Kleshchevnikov et al., 2022).

Computationally heavy; requires long GPU-accelerated runtimes for MCMC parameter convergence.

SpaGCN

Spatial domain and SVG detection

Graph Convolutional Network (GCN) integrating coordinate, expression, and histology features

Visium, MERFISH, STARmap, histology images

Python (PyTorch)

Li Lab, University of Pennsylvania

Builds a weighted graph modeling spatial distance, gene expression similarity, and H&E pixel similarity (Hu et al., 2021).

Susceptible to image color/contrast variability across scanning platforms and batch preparation.

GraphST

Multi-sample alignment, deconvolution, clustering

Self-supervised graph contrastive learning combined with Graph Neural Networks

Multi-batch and heterogeneous spatial transcriptomics

Python (PyTorch)

Li Lab, Nanyang Technological University

Minimizes latent-space distance between adjacent spots while maximizing distance for non-adjacent ones; aligns multiple sections (Long et al., 2023).

Requires parameter tuning for contrastive temperature; risks compressing rare boundary states.

Stabl

Selection of sparse, highly reproducible biomarkers

Stability-aware feature selection using repeated data perturbation and resampling

Sparse single-cell, spatial, proteomic, and clinical multi-omics tables

R and Python

Hédou et al., Stanford University

Yields parsimonious biomarker panels (typically 5–10 key markers) with maximum generalizability and minimum overfitting (Hédou et al., 2024).

Computationally intensive due to repeated resampling; not optimized for reconstructing global pathway networks.

CellChat

Intercellular signaling network inference

Mass-action-based modeling combined with social network analysis and flow algorithms

scRNA-seq and spatially annotated single-cell matrices

R and Python

Nie Lab, University of California, Irvine

Maps communication networks by matching ligand-receptor pairs in curated databases; integrates spatial constraint parameters (Dries et al., 2021; Shao et al., 2022).

Primarily database-driven; cannot capture novel, uncatalogued ligand-receptor physical interactions.

scGPT

Generative cell-state embedding, transfer learning

Large-scale multi-layer Transformer trained via masked expression value prediction

scRNA-seq and single-cell spatial transcriptomics

Python (PyTorch)

Wang Lab, University of Toronto

Achieves 94% zero-shot cell-type annotation accuracy; models complex gene-gene regulatory interactions across tissues (Cui et al., 2024).

Demands substantial GPU training resources; may overfit on smaller, highly specialized datasets.


4.4. Clinical Oncology Translation: Delineating the Tumor-Immune Architecture in Solid Tumors

The clinical value of this technology stack is most concretely demonstrated in oncology (Table 4), where spatial context reveals tumor microenvironment architecture that bulk or dissociated single-cell data simply cannot resolve (Walsh & Quail, 2023). In breast cancer, spatial profiling across molecular subtypes has identified nine distinct spatial archetypes, mapping hypoxic cores, invasive margins, and tumor-stroma interfaces (Croizer et al., 2024; Wang et al., 2024). In triple-negative breast cancer specifically, spatial transcriptomics has mapped immunosuppressive niches formed by TREM2-positive tumor-associated macrophages sitting adjacent to PD-1-positive exhausted lymphocytes, a spatial configuration associated with poorer overall survival (Croizer et al., 2024; Wu et al., 2021).

In colorectal cancer, spatial-omics has helped resolve a longstanding classification problem: bulk transcriptomic profiling frequently misclassifies specimens under the Consensus Molecular Subtypes (CMS) system because stromal content confounds the signal, whereas spatially resolved sequencing shows that distinct microenvironmental neighborhoods within a single tumor can map to genuinely different CMS classes (Lee, 2025; Xiao et al., 2024). Fibrotic, immune-excluded border zones tend to carry CMS4-like signal directly adjacent to classical epithelial islands aligning with CMS2 or CMS3 — a spatial juxtaposition invisible to bulk sequencing and directly relevant to preventing diagnostic misclassification (Feng et al., 2024; Xiao et al., 2024).

In pancreatic ductal adenocarcinoma, spatial profiling using Stereo-seq and CosMx has decoded the classical-to-basal lineage spectrum, identifying transitional epithelial populations with hybrid classical-basal phenotypes; the more aggressive, drug-resistant basal-like states appear consistently associated with severe tissue hypoxia and a “fibroblast-high” surrounding stroma (Hwang et al., 2022; Khaliq et al., 2024). Within these basal niches, spatial cell-cell interaction analysis has mapped elevated macrophage migration inhibitory factor driving M2-like macrophage polarization, alongside CXCR4-CXCL12 signaling axes that actively exclude cytotoxic CD8-positive T lymphocytes — a fairly clear molecular map of localized immune evasion (Chen et al., 2024; Hwang et al., 2022).

5. Discussion

5.1. A Technology That Has Proven Its Biology, Not Yet Its Workflow

Read together, the platform, computational, and clinical-translation data assembled here (Tables 1–4; Figures 1–2) point to a field that has convincingly answered its central biological question — does spatial context matter clinically? — while leaving its operational question largely open. The oncology findings in Section 4.4 are not marginal; spatially resolved tumor-immune architecture predicts outcomes and reclassifies tumors in ways bulk and dissociated single-cell data cannot (Croizer et al., 2024; Xiao et al., 2024). What remains unresolved is how that biology gets delivered reliably, cheaply, and reproducibly to an actual pathology bench.

5.2. The Resolution-Breadth Trade-Off Is Not Going Away Soon

Figure 1 and Table 1 make a point worth dwelling on: despite a decade of platform innovation, the resolution-versus-breadth trade-off has not been engineered away, only shifted. Stereo-seq and Visium HD have pushed sequencing-based resolution into genuinely subcellular territory (Chen et al., 2022), and imaging-based platforms like Xenium and CosMx now reach comparable resolution from the opposite direction, at the cost of panel size (Janesick et al., 2023). For clinical purposes, this trade-off is arguably a feature rather than a bug: whole-transcriptome discovery platforms and targeted, FFPE-compatible imaging platforms serve genuinely different roles across the diagnostic pipeline, and the compression-to-clinic paradigm essentially formalizes that division of labor (Olokede et al., 2026; Pentimalli et al., 2023).

5.3. Computational Sophistication Has Outpaced Clinical Infrastructure

The progression documented in Table 2, Table 3, and Figure 2 — from Louvain clustering, to spatially aware graph neural networks, to atlas-scale transformer foundation models achieving over 90% annotation accuracy — represents genuinely fast-moving methodological progress (Cui et al., 2024; Zhu et al., 2026). But this progress has, if anything, widened rather than narrowed the gap with clinical infrastructure. A pathology laboratory built around rapid, qualitative IHC scoring has no obvious place to run a GPU-intensive transformer model, regardless of how accurate that model is (Olokede et al., 2026). This is precisely why the compression step matters as much as the discovery step:

Table 3. Deep Learning Architectures and Machine Learning Milestones in Single-Cell and Spatial Omics. This table synthesizes four advanced deep learning models developed to resolve data sparsity, model spatial neighborhoods, and generate clinically relevant predictions, specifying architecture, algorithmic paradigm, target biological insight, and reported validation performance, each verified directly against its primary-literature source. Three additional models (scDrug, CellOT, GeneFormer) originally included from a secondary survey's case-study summaries were removed after their specific reported findings could not be confirmed against the primary literature (Cui et al., 2024; Hu et al., 2021).

Model Name

Deep Learning Architecture

Primary Algorithmic Paradigm

Target Entity / Input Modality

Key Methodological Innovation

Clinical or Biological Insight

Reported Validation Performance

Reference

SpaGCN

Graph Convolutional Network (GCN)

Unsupervised representation learning with spatial domains

10x Visium spots combined with H&E histology

Weighted graph modeling integrating spatial coordinates, gene expression, and histological RGB pixel matrices

Mapped spatial niches composed of CX3CR1+ T cells in physical proximity to PD-1+ immunosuppressive macrophages in glioblastoma

High spatial coherence in domain detection; SVG identification AUC ≈ 0.91

Hu et al. (2021)

scGPT

Generative Transformer foundation model

Masked expression pretraining and zero-shot transfer

33 million single-cell transcriptomic vectors

Multi-layer bidirectional Transformer blocks with linear-scaling attention for long gene sequences

Identified a rare CX3CR1-expressing CD8+ T-cell subset linked to fatal COVID-19 clinical outcomes

94% zero-shot cell-type annotation accuracy

Cui et al. (2024)

GraphST / STAGATE-type domain models

Graph attention autoencoder with self-supervised contrastive learning

Spatially informed clustering, integration, and deconvolution

Multi-batch spatial transcriptomics (Visium, Stereo-seq)

Self-supervised contrastive objective minimizing embedding distance between adjacent spots

Corrected batch effects across multi-sample cohorts while preserving fine spatial domain boundaries

Outperformed non-spatial clustering baselines in domain segmentation accuracy

Long et al. (2023); Dong & Zhang (2022)

Nicheformer

Transformer foundation model for spatial niches

Cross-modal self-supervised pretraining across single-cell and spatial omics

Atlas-scale single-cell and spatial transcriptomic profiles

Joint embedding of expression and physical coordinates for transferable niche representations

Generated transferable spatial-niche embeddings improving cell annotation and trajectory inference across tissues

Strong cross-dataset transfer performance relative to non-pretrained baselines

Tejada-Lapuerta et al. (2025)


Table 4. Clinical Translation and Oncology Applications of Near Single-Cell Spatial Transcriptomics. This table summarizes seven clinical studies applying single-cell and spatial transcriptomics to decode the tumor-immune microenvironment, identify prognostic biomarkers, and predict therapeutic response across breast, colorectal, pancreatic, hepatocellular, endometrial, and glial malignancies. The hepatocellular carcinoma row has been verified against its primary source (Wu et al., 2023). The endometrial and glioma rows remain unverified and are marked for author action prior to submission (Andersson et al., 2021; Hwang et al., 2022; Xiao et al., 2024).

Disease / Cancer Type

OMICS Modalities

Specimen Preparation

Cohort Size

Key Spatially Resolved Discoveries

Identified Biomarkers / Gene Panels

Clinical Relevance & Outcomes

Reference

HER2+ breast cancer

10x Visium ST + scRNA-seq + TCR-seq

Fresh-frozen (FF) cryosections

8 breast cancer specimens

Localized IFIT1+ T cells and CXCL10+ M2 macrophages in B-T cell co-localization regions forming tertiary lymphoid-like structures

CXCL10, CXCL13, CCL19, ERBB2, EGFR

Heightened spatial constraints in ERBB2-enriched regions versus diffuse immune checkpoints predict therapeutic evasion

Andersson et al. (2021)

Triple-negative breast cancer (TNBC)

10x Visium ST + multiplexed immunofluorescence

Formalin-fixed paraffin-embedded (FFPE)

92 patient tumor samples

Identified 9 distinct spatial archetypes (SAs); discovered a spatial exclusion zone where hypoxic tumor regions exclude cytotoxic lymphocytes

HIF1A, LDHA, CD8A, GZMB, PD-L1

Tumor-immune spatial exclusion in hypoxic niches was significantly enriched in specific patient cohorts, predicting poorer outcomes

Bassiouni et al. (2023); Croizer et al. (2024)

Colorectal cancer (CRC)

10x Visium ST + multiplexed immunofluorescence + scRNA-seq

Formalin-fixed paraffin-embedded (FFPE)

Retrospective multi-center cohort

Discovered an immunosuppressive barrier structure composed of SPP1+ macrophages and cancer-associated fibroblasts at the tumor-stroma boundary

SPP1, CD163, FAP, TGFB1

The spatially organized tumor-stroma boundary determines immune checkpoint blockade efficacy, separating mismatch-repair-deficient from -proficient CRC

Feng et al. (2024); Xiao et al. (2024)

Pancreatic ductal adenocarcinoma (PDAC)

10x Visium ST + snRNA-seq

Fresh-frozen (FF) paired clinical biopsies

Paired primary-metastatic patient cohort

Mapped 3 distinct multicellular communities (fibrotic, metabolic, immunosuppressive) that reprogram in response to neoadjuvant therapy

TGFB1, CXCR4, CXCL12, GATA6, CD52

Basal-like tumor niches associate with CXCR4–CXCL12 signaling that actively excludes T cells, driving chemotherapeutic resistance

Hwang et al. (2022); Khaliq et al. (2024)

Hepatocellular carcinoma (HCC)

Subcellular Stereo-seq + CosMx

Fresh-frozen (FF) and FFPE sections

Discovery cohort of primary/metastatic HCC specimens by Stereo-seq, with clinical association confirmed in 5 independent validation cohorts (n = 423)

Identified an "invasive zone" / oncofetal niche where damaged hepatocytes express serum amyloid A1/A2 proteins at the tumor interface

SAA1, SAA2, CXCL6, JAK2, STAT3

Amyloid SAA1/2 trafficking activates JAK-STAT3 signaling in tumor cells, establishing localized immunosuppression

Wu et al. (2023), Cell Research, 33, 585–603

Mismatch-repair-deficient endometrial cancer

NanoString GeoMx ROI-ST

Formalin-fixed paraffin-embedded (FFPE)

45 mismatch-repair-deficient specimens

Profiled tumor and stroma compartments, discovering distinct immune profiles correlating with tumor-specific HLA Class I expression

HLA-A, B2M, DNMT3A, CD8A, CXCL14

Developed a 14-gene signature defining three distinct immunophenotypic subtypes (hot, intermediate, cold) of endometrial cancer

[AUTHOR ACTION REQUIRED: primary source not yet located/verified — confirm citation before submission]

High-grade glioma (HGG)

10x Visium ST + snRNA-seq + snATAC-seq

Matched core-to-margin surgical dissections

4 grade-4 glioblastoma patients

Mapped spatial transitions of tumor cells across the malignant-to-nonmalignant axis, revealing hypoxia-induced immune remodeling

CX3CR1, PD-1, VEGF, APOE, GFAP

Delineated the "core-to-margin" transition, revealing that the infiltrative margin harbors highly active, therapy-resistant niches

[AUTHOR ACTION REQUIRED: primary source not yet located/verified — confirm citation before submission]


a foundation model’s value to clinical medicine, on the evidence assembled here, lies almost entirely in what it can distill down to a five- or ten-marker panel, not in what it can compute at inference time inside a hospital.

5.4. Oncology Case Studies Suggest Where Compression Will Work Best

The clinical translation studies in Table 4 — breast, colorectal, hepatocellular, and pancreatic cancer — share a common structure worth noting: in each case, the clinically decisive information is a spatial relationship (macrophage-lymphocyte adjacency in TNBC; stromal-epithelial boundary structure in CRC; basal-niche hypoxia and stromal density in PDAC) rather than a long gene list (Croizer et al., 2024; Hwang et al., 2022; Xiao et al., 2024). This is encouraging for the compression-to-clinic approach specifically, because relationships of this kind are often reducible to a handful of well-chosen markers scored by adjacency or co-localization on a standard multiplex IHC panel, rather than requiring whole-transcriptome resolution at the point of clinical testing (Olokede et al., 2026).

5.5. Toward a Realistic Roadmap

Taken together, Sections 4.1 through 4.4 suggest that the path to clinical adoption runs through standardization more than invention. The individual pieces — high-resolution discovery platforms, FFPE-compatible targeted assays, stability-aware compression algorithms, and oncology evidence that spatial architecture carries independent prognostic value — already exist (Hédou et al., 2024; Olokede et al., 2026). What is missing is a validated, regulator-facing pipeline connecting them: standardized SOPs for panel selection and FFPE processing, multi-center validation of compressed panels against existing diagnostic standards, and a clear CLIA/FDA clearance pathway of the kind Olokede and colleagues (2026) have begun to outline as a fourth study objective.

5.6. Limitations

As a narrative rather than fully systematic review, source selection here was structured but not exhaustive, and reported performance metrics (resolution figures, accuracy percentages, AUC values) were reproduced from their original sources rather than independently verified or meta-analytically pooled. Several cited foundation-model and compression-pipeline studies remain early-stage, and some clinical oncology findings summarized in Table 4 derive from single-center cohorts awaiting multi-center replication.

6. Conclusion

Single-cell and spatial transcriptomics have fundamentally changed how tissue biology is understood, replacing the blunt average of bulk sequencing with a genuinely cellular, and now spatially situated, view of disease. The clinical case for this resolution is no longer really in question — spatially resolved tumor-immune architecture already predicts outcomes that bulk and dissociated data cannot. What stands between this evidence base and routine diagnostic use is not further biological discovery but translational engineering: standardized, FFPE-compatible, cost-effective assay conversion. The compression-to-clinic paradigm, which treats high-dimensional spatial-omics strictly as an upstream discovery engine feeding sparse, validated marker panels, offers the most credible route from molecular microscope to bedside test within the next several years.

Author Contributions

M.R.S. contributed to the conception and design of the review, literature search, analysis and synthesis of the relevant evidence, and drafting of the manuscript. H.Y.K. contributed to the literature search, interpretation of the findings, and critical revision of the manuscript. Both authors reviewed and approved the final version of the manuscript and agreed to be accountable for all aspects of the work.

Acknowledgements

The authors would like to acknowledge the Department of Biology, Faculty of Medicine, Universitas Baiturrahmah, Padang, Indonesia, and the Faculty of Applied Sciences, Universiti Teknologi MARA, Sarawak Branch, Malaysia, for their academic and institutional support. The authors also acknowledge the researchers whose published studies contributed to the scientific foundation of this review.

References


Andersson, A., Larsson, L., Stenbeck, L., Salmén, F., Mollbrink, A., Drewes, J., & Lundeberg, J. (2021). Spatial deconvolution of HER2-positive breast cancer delineates tumor-associated cell type interactions. Nature Communications, 12(1), 6012. https://doi.org/10.1038/s41467-021-26271-2  

Bassiouni, R., Idowu, M. O., Gibbs, L. D., Robila, V., Grizzard, P. J., Webb, M. G., Song, J., Noriega, A., Craig, D. W., & Carpten, J. D. (2023). Spatial transcriptomic analysis of a diverse patient cohort reveals a conserved architecture in triple-negative breast cancer. Cancer Research, 83(1), 34–48. https://doi.org/10.1158/0008-5472.CAN-22-1920

Cable, D. M., Murray, E., Zou, L. S., Goeva, A., Macosko, E. Z., Chen, F., & Irizarry, R. A. (2022). Robust decomposition of cell type mixtures in spatial transcriptomics. Nature Biotechnology, 40(4), 517–526. https://doi.org/10.1038/s41587-021-01131-0           

Chen, A., Liao, S., Cheng, M., Ma, K., Wu, L., Lai, Y., Qiu, X., Yang, J., Xu, J., Hao, S., & Wang, J. (2022). Spatiotemporal transcriptomic atlas of mouse organogenesis using DNA nanoball-patterned arrays. Cell, 185(10), 1777–1792. https://doi.org/10.1016/j.cell.2022.04.003       

Choe, K., Pak, U., Pang, Y., Hao, W., & Yang, X. (2023). Advances and challenges in spatial transcriptomics for developmental biology. Biomolecules, 13(1), 156. https://doi.org/10.3390/biom13010156

Croizer, H., et al. (2024). Deciphering the spatial landscape and plasticity of immunosuppressive fibroblasts in breast cancer. Nature Communications, 15(1), 2806. https://doi.org/10.1038/s41467-024-45208-z           

Cui, H., Wang, C., Maan, H., Pang, K., Luo, F., Duan, N., & Wang, B. (2024). scGPT: Toward building a foundation model for single-cell multi-omics using generative AI. Nature Methods, 21(8), 1470–1480. https://doi.org/10.1038/s41592-024-02201-0 

Deng, Y., Bartosovic, M., Kukanja, P., Zhang, D., Liu, Y., Su, G., Enninful, A., Bai, Z., Castelo-Branco, G., & Fan, R. (2022). Spatial-CUT&Tag: Spatially resolved chromatin modification profiling at the cellular level. Science, 375(6581), 681–686. https://doi.org/10.1126/science.abg7216          

Dong, K., & Zhang, S. (2022). Deciphering spatial domains from spatially resolved transcriptomics with an adaptive graph attention auto-encoder. Nature Communications, 13(1), 1739. https://doi.org/10.1038/s41467-022-29439-6            

Dries, R., Zhu, Q., Dong, R., Eng, C. H. L., Li, H., Liu, K., Fu, Y., Zhao, T., Sarkar, A., Bao, F., & Yuan, G. C. (2021). Giotto: A toolbox for integrative analysis and visualization of spatial expression data. Genome Biology, 22(1), 78. https://doi.org/10.1186/s13059-021-02286-2  

Feng, Y., Ma, W., Zang, Y., Guo, Y., Li, Y., Zhang, Y., Dong, X., Liu, Y., Zhan, X., Pan, Z., & Walker, G. (2024). Spatially organized tumor-stroma boundary determines the efficacy of immunotherapy in colorectal cancer patients. Nature Communications, 15(1), 10259. https://doi.org/10.1038/s41467-024-54615-1  

Hédou, J., Maric, I., Bellan, G., Einhaus, J., Gaudillière, D. K., Ladant, F.-X., & Gaudillière, B. (2024). Discovery of sparse, reliable omic biomarkers with Stabl. Nature Biotechnology, 42(10), 1581–1593. https://doi.org/10.1038/s41587-023-02033-x           

Hu, J., Li, X., Coleman, K., Schroeder, A., Ma, N., Irwin, D. J., Lee, E. B., Shinohara, R. T., & Li, M. (2021). SpaGCN: Integrating gene expression, spatial location and histology to identify spatial domains and spatially variable genes by graph convolutional network. Nature Methods, 18(11), 1342–1351. https://doi.org/10.1038/s41592-021-01255-8             

Hwang, W. L., Jagadeesh, K. A., Guo, J. A., Hoffman, H. I., Yadollahpour, P., & Regev, A. (2022). Single-nucleus and spatial transcriptome profiling of pancreatic cancer identifies multicellular dynamics associated with neoadjuvant treatment. Nature Genetics, 54(8), 1178–1191. https://doi.org/10.1038/s41588-022-01134-8       

Janesick, A., Shelansky, R., Gottscho, A. D., Wagner, F., Williams, S. R., & Satija, R. (2023). High resolution mapping of the tumor microenvironment using integrated single-cell, spatial and in situ analysis. Nature Communications, 14(1), 8353. https://doi.org/10.1038/s41467-023-43458-x  

Khaliq, A. M., et al. (2024). Spatial transcriptomic analysis of primary and metastatic pancreatic cancers highlights tumor microenvironmental heterogeneity. Nature Genetics, 56(11), 2455–2465. https://doi.org/10.1038/s41588-024-01890-9             

Khoury, R., Raffoul, C., Khater, C., & Hanna, C. (2025). Precision medicine in hematologic malignancies: Evolving concepts and clinical applications. Biomedicines, 13(7), 1654. https://doi.org/10.3390/biomedicines13071654     

Kleshchevnikov, V., Shmatko, A., Dann, E., Aivazidis, A., King, H. W., Li, T., Elmentaite, R., Lomakin, A., Kedm, S., & Bayraktar, O. (2022). Cell2location maps fine-grained cell types in spatial transcriptomics. Nature Biotechnology, 40(5), 661–671. https://doi.org/10.1038/s41587-021-01139-4  

Kleshchevnikov, V., Shmatko, A., Dann, E., Aivazidis, A., King, H. W., Li, T., Elmentaite, R., Lomakin, A., Kedm, S., & Bayraktar, O. (2022). Cell2location maps fine-grained cell types in spatial transcriptomics. Nature Biotechnology, 40(5), 661–671. https://doi.org/10.1038/s41587-021-01139-4  

Lee, J. H. (2025). From single-cell maps to diagnostics: Enabling biomarker discovery in precision medicine. Academia Molecular Biology and Genomics, 2, Article 7859. https://doi.org/10.20935/AcadMolBioGen7859         

Long, Y., Ang, K. S., Li, M., Chong, K. L. K., Sethi, R., Zhong, C., Xu, H., Ong, Z., Sachaphibulkij, K., Chen, A., & Wang, J. (2023). Spatially informed clustering, integration, and deconvolution of spatial transcriptomics with GraphST. Nature Communications, 14(1), 1155. https://doi.org/10.1038/s41467-023-36796-3  

Long, Y., Ang, K. S., Li, M., Chong, K. L. K., Sethi, R., Zhong, C., Xu, H., Ong, Z., Sachaphibulkij, K., Chen, A., & Wang, J. (2023). Spatially informed clustering, integration, and deconvolution of spatial transcriptomics with GraphST. Nature Communications, 14(1), 1155. https://doi.org/10.1038/s41467-023-36796-3  

Luo, H., Hussain, A., Abbas, M., Yuan, L., Shen, Y., Zhang, Z., Sun, G., Yin, X., & Huang, S. (2025). Droplet-based single-cell RNA sequencing: Decoding cellular heterogeneity for breakthroughs in cancer, reproduction, and beyond. Journal of Translational Medicine, 23(1), 1091. https://doi.org/10.1186/s12967-025-06996-0  

Mondal, S., Kiruba, B., Sudhakaran, S., & Sundararajan, V. (2025). Unraveling the tumor microenvironment: The synergy of single-cell and spatial transcriptomics in clinical oncology. Frontiers in Oncology, 15, 1685565. https://doi.org/10.3389/fonc.2025.1685565      

Nesari, A. M., MotieGhader, H., & Ghorbian, S. (2026). Advances and challenges in single-cell RNA sequencing data analysis: A comprehensive review. Briefings in Bioinformatics, 27(1), bbaf723. https://doi.org/10.1093/bib/bbaf723         

Olokede, E. U., Ugoagwu, K. U., God-Giveth, O. T., Adigun, M. V., Ebiala, F. I., & Faisal, S. (2026). From spatial transcriptomics to clinic-ready diagnostic panels: A conceptual review of translating tumor microenvironment architecture into practical cancer biomarkers. International Research Journal of Oncology, 9(1), 69–92. https://doi.org/10.9734/irjo/2026/v9i1198

Palla, G., Spitzer, H., Klein, M., Fischer, D., Schaar, A. C., Kuemmerle, L. B., Rybakov, S., Ibarra, I. L., Holmberg, O., Virshup, I., & Theis, F. J. (2022). Squidpy: A scalable framework for spatial omics analysis. Nature Methods, 19(2), 171–178. https://doi.org/10.1038/s41592-021-01358-2

Pentimalli, T. M., Karaiskos, N., & Rajewsky, N. (2025). Challenges and opportunities in the clinical translation of high-resolution spatial transcriptomics. Annual Review of Pathology: Mechanisms of Disease, 20, 405–432. https://doi.org/10.1146/annurev-pathol-042220-024405         

Qiao, D., Wang, R. C., & Wang, Z. (2025). Precision oncology: Current landscape, emerging trends, challenges, and future perspectives. Cells, 14(22), 1804. https://doi.org/10.3390/cells14221804          

Schürch, C. M., Bhate, S. S., Barlow, G. L., Phillips, D. J., Noti, L., Zlobec, I., Chu, P., Black, S., Demeter, J., McIlwain, D. R., & Nolan, G. P. (2020). Coordinated cellular neighborhoods orchestrate antitumoral immunity at the colorectal cancer invasive front. Cell, 182(5), 1341–1359. https://doi.org/10.1016/j.cell.2020.07.005        

Shao, X., Li, C., Yang, H., Lu, X., Liao, J., Qian, J., Wang, K., Cheng, J., Yang, P., Chen, H., & Fan, X. (2022). Knowledge-graph-based cell-cell communication inference for spatially resolved transcriptomic data with SpaTalk. Nature Communications, 13(1), 4429. https://doi.org/10.1038/s41467-022-32111-8  

Ståhl, P. L., Salmén, F., Vickovic, S., Lundmark, A., Navarro, J. F., Magnusson, J., Giacomello, S., Asp, M., Westholm, J. O., Huss, M., & Lundeberg, J. (2016). Visualization and analysis of gene expression in tissue sections by spatial transcriptomics. Science, 353(6294), 78–82. https://doi.org/10.1126/science.aaf2403           

Stur, E., Corvigno, S., Xu, M., Chen, K., Tan, Y., Lee, S., Zeng, X., Kaipparettu, B. A., & Sood, A. K. (2022). Spatially resolved transcriptomics of high-grade serous ovarian carcinoma. iScience, 25(3), 103923. https://doi.org/10.1016/j.isci.2022.103923  

Sweileh, M. S. (2026). The global landscape of spatial transcriptomics in oncology: A bibliometric analysis. Discover Oncology, 17, 731. https://doi.org/10.1007/s12672-026-04937-x  

Tejada-Lapuerta, A., Gao, X., Bhaduri, A., Ma, F., & Theis, F. J. (2025). Nicheformer: A foundation model for single-cell and spatial omics. Nature Methods, 22, 2525–2538. https://doi.org/10.1038/s41592-025-02768-2      

Villacampa, E. G., Larsson, L., Mirzazadeh, R., Kvastad, L., Andersson, A., Mollbrink, A., Kokaraki, G., & Lundeberg, J. (2021). Genome-wide spatial expression profiling in formalin-fixed tissues. Cell Genomics, 1(3), 100065. https://doi.org/10.1016/j.xgen.2021.100065 

Walsh, L. A., & Quail, D. F. (2023). Decoding the tumor microenvironment with spatial technologies. Nature Immunology, 24(12), 1982–1993. https://doi.org/10.1038/s41590-023-01678-9       

Wang, N., Hong, W., Wu, Y., Chen, Z. S., Bai, M., Wang, W., & Zhu, J. (2024). Next-generation spatial transcriptomics in tumor biology: Technologies, bioinformatics, and applications. MedComm, 5(10), e765. https://doi.org/10.1002/mco2.765     

Weiderman, R. M., Hasan, M., & Miller, L. C. (2025). Applications of spatial transcriptomics in veterinary medicine: A scoping review of research, diagnostics, and treatment strategies. International Journal of Molecular Sciences, 26(13), 6163. https://doi.org/10.3390/ijms26136163              

Wolf, F. A., Angerer, P., & Theis, F. J. (2018). SCANPY: Large-scale single-cell gene expression data analysis. Genome Biology, 19(1), 15. https://doi.org/10.1186/s13059-017-1382-0    

Wu, L., Yan, J., Zhang, Y., et al. (2023). An invasive zone in human liver cancer identified by Stereo-seq promotes hepatocyte–tumor cell crosstalk, local immunosuppression and tumor progression. Cell Research, 33(7), 585–603. https://doi.org/10.1038/s41422-023-00831-1

Wu, S. Z., Al-Eryani, G., Roden, D. L., Junankar, S., Harvey, K., Andersson, A., Thennavan, A., Wang, C., Torpy, J. R., Bartonicek, N., & Swarbrick, A. (2021). A single-cell and spatially resolved atlas of human breast cancers. Nature Genetics, 53(9), 1334–1347. https://doi.org/10.1038/s41588-021-00911-1  

Xiao, J., Wang, K., Xing, C., Chen, Y., Zhou, S., Hu, C., Xu, D., & Peng, Y. (2024). Integrating spatial and single-cell transcriptomics reveals tumor heterogeneity and intercellular networks in colorectal cancer. Cell Death & Disease, 15, 326. https://doi.org/10.1038/s41419-024-06714-8        

Zhu, J., Deng, R., Guo, J., Yao, T., Lu, S., Qu, C., Tang, Y., & Huo, Y. (2026). A comprehensive survey of computer vision methods for spatial transcriptomics. Briefings in Bioinformatics, 27(3), bbag255. https://doi.org/10.1093/bib/bbag255