Integrative Biomedical Research

Integrative Biomedical Research (Journal of Angiotherapy) | Online ISSN  3068-6326
463
Citations
1.9m
Views
801
Articles
Your new experience awaits. Try the new design now and help us make it even better
Switch to the new experience
Figures and Tables
REVIEWS   (Open Access)

Computational drug repurposing for amyotrophic lateral sclerosis, from transcriptomic prediction to pharmacological validation

Ruslan Rakhmanov 1*, Anvar Takhirov 2

+ Author Affiliations

Integrative Biomedical Research 10 (2) 1-8 https://doi.org/10.25163/biomedical.10210958

Submitted: 08 September 2026 Revised: 25 October 2026  Published: 06 November 2026 


Abstract

Amyotrophic lateral sclerosis (ALS) remains one of the most unforgiving diseases in neurology. Motor neurons in the cortex, brainstem, and spinal cord degenerate relentlessly, and most patients die of respiratory failure within two to five years of onset. Riluzole, edaravone, and tofersen are the only approved disease-modifying agents, yet their benefits are modest or confined to a small genetic subgroup. This gap has pushed researchers toward drug repurposing, and increasingly toward computational methods for doing it. In this structured narrative review of 34 sources, we examine how transcriptome-wide machine-learning ensembles, weighted gene co-expression networks, connectivity mapping, single-cell Mendelian randomization, and knowledge-graph approaches have been used to nominate repurposable drugs for ALS. We also place these predictions alongside recent fluid-biomarker, clinical, and neuroimaging evidence. Four pipelines stand out, each drawing on a different tissue. They nominated deferoxamine and disulfiram (metal and redox stress), memantine and other SMN1-network modulators (RNA metabolism), clonidine and fingolimod (immune-metabolic signalling), and glibenclamide, tamoxifen, and quercetin (cytotoxic CD4? T-cell inflammation). The picture is less reassuring once specificity is tested. Motor-cortex and blood signatures barely overlap. A blood signature that performed well against healthy controls fell to chance level (AUC = 0.525) against disease mimics. Perturbation data come largely from cancer cell lines, and almost no candidate has been checked for potency, blood–brain barrier penetration, or dose–response. We argue that mimic-inclusive modelling, validation in human iPSC-derived and organoid systems, and quantitative pharmacokinetic–pharmacodynamic work are needed before these computational leads can reasonably be treated as therapeutic candidates rather than well-formed hypotheses.

Keywords: amyotrophic lateral sclerosis; drug repurposing; systems pharmacology; machine learning; connectivity map; Mendelian randomization; WGCNA; translational neurology

1. Introduction

Amyotrophic lateral sclerosis (ALS) is, in the plainest terms, a disease of lost connection. Upper motor neurons in the cerebral cortex and lower motor neurons in the brainstem and spinal cord degenerate selectively and progressively (Feldman et al., 2022; Hardiman et al., 2017). Patients experience this as a slow unravelling: muscles weaken and waste, fasciculations appear, spasticity sets in, and paralysis follows. Death, usually from respiratory failure, typically comes within two to five years of the first symptom (Ataei et al., 2026; Liu et al., 2026). Roughly nine in ten cases are sporadic. The remaining tenth are familial and have been linked to pathogenic variants in more than 30 genes, most prominently C9orf72, SOD1, TARDBP (which encodes TDP-43), and FUS (Ataei et al., 2026; Hardiman et al., 2017).

The therapeutic record, despite decades of trials, is sobering (Liu et al., 2026; Masrori & Van Damme, 2020). Only three disease-modifying agents have reached regulatory approval: riluzole, an antiglutamatergic drug; edaravone, a free-radical scavenger; and tofersen, an intrathecal antisense oligonucleotide directed against mutant SOD1 mRNA (Feldman et al., 2022; Miller et al., 2022). Tofersen, while conceptually important, is relevant to only about 2% of patients, namely those who carry SOD1 variants. Riluzole and edaravone, for their part, buy modest survival or a temporary slowing of functional decline (Feldman et al., 2022; Liu et al., 2026). It is tempting to read these results as a story of weak drugs. A more uncomfortable reading, and probably the more accurate one, is that single-target agents are being asked to correct a disease that is neither single-target nor linear (deAndrés-Galiana et al., 2026; Liu et al., 2026).

Consider what the pathology actually involves. In more than 95% of cases, TDP-43 is cleared from the nucleus and accumulates in cytoplasmic aggregates. Around that core sit glutamate excitotoxicity, impaired nucleocytoplasmic transport, altered RNA splicing, oxidative stress, mitochondrial decline, neuroinflammation, and a gradual failure of proteostasis (Ataei et al., 2026; deAndrés-Galiana et al., 2026; Sultan et al., 2026). These processes do not run in parallel so much as feed one another. A drug that nudges one of them may simply be outpaced by the others.

This is partly why drug repurposing has become attractive. Repurposing means finding new indications for molecules that are already approved or have been characterised clinically. Conventional de novo discovery is extraordinarily expensive, takes a decade or more, and loses well over 90% of its candidates in late-stage trials (deAndrés-Galiana et al., 2026; Li & Kar, 2025; Pushpakom et al., 2019). Repurposed compounds arrive with human safety, pharmacokinetic, and toxicology data already in hand, which can shorten the path from bench to bedside considerably (deAndrés-Galiana et al., 2026; Li & Kar, 2025). The historical weakness of repurposing was that it depended heavily on chance clinical observation. That, at least, has begun to change.

High-throughput multi-omics, computational network biology, and artificial intelligence have made it possible to search for repurposable drugs systematically rather than serendipitously (Eshak & Arumugam, 2025; Li & Kar, 2025; Xie et al., 2025). Modern workflows mine large transcriptomic, genomic, and proteomic datasets to build disease signatures and target networks (deAndrés-Galiana et al., 2026; Eshak & Arumugam, 2025; Sultan et al., 2026). Machine-learning ensembles such as random forest, least absolute shrinkage and selection operator (LASSO) regression, and support vector machine recursive feature elimination (SVM-RFE) can extract gene signatures that recur across post-mortem central nervous system (CNS) tissue and peripheral blood. Tools such as Co-expressed Gene-set Enrichment Analysis (COGENA) can then query those signatures against the Connectivity Map (CMap) to find compounds whose expression profiles appear to oppose the disease state (deAndrés-Galiana et al., 2026; Jia et al., 2016; Sultan et al., 2026). Weighted gene co-expression network analysis (WGCNA) takes a different route, grouping dysregulated transcripts into modules and isolating highly connected hub genes that can be mapped to approved drugs through resources such as the Drug–Gene Interaction Database (DGIdb) and Gene2Drug (Eshak & Arumugam, 2025; Sultan et al., 2026). Single-cell RNA sequencing of peripheral blood mononuclear cells (PBMCs), combined with Mendelian randomization, adds something that earlier approaches lacked: a way of asking whether a candidate target is likely to be causal or merely reactive (Pang et al., 2026). Deep learning, graph neural networks, molecular docking, and knowledge graphs now extend these searches across enormous chemical spaces, estimating affinity, polypharmacology, and even blood–brain barrier (BBB) penetration (Li & Kar, 2025; Sedighi et al., 2026; Xie et al., 2025).

These workflows have already produced a list of candidates. Motor-cortex transcriptomics pointed to deferoxamine and disulfiram (deAndrés-Galiana et al., 2026). Network analysis of spinal and oculomotor datasets placed SMN1 at the centre of a druggable module and linked it to memantine, niclosamide, and several polyphenols (Eshak & Arumugam, 2025). Whole-blood transcriptomics suggested clonidine and fingolimod (Sultan et al., 2026), and single-cell Mendelian randomization implicated glibenclamide, tamoxifen, chlorzoxazone, ampyrone, and quercetin (Pang et al., 2026). On paper, this looks like progress. Whether it is progress in a clinical sense is less clear.

Several problems recur. Signatures derived from the motor cortex share very little with those derived from blood (deAndrés-Galiana et al., 2026). Classifiers trained only to separate patients from healthy controls often cannot tell ALS from its mimics, such as cervical myelopathy or multifocal motor neuropathy, and may be capturing a generic neuroinflammatory or muscle-injury response instead (Sultan et al., 2026). Models built on microarray data do not always carry over to RNA-sequencing cohorts (Sultan et al., 2026). CMap perturbation profiles were generated mostly in immortalised cancer cell lines, which say little about motor neurons, glia, or the human BBB (deAndrés-Galiana et al., 2026). And perhaps most importantly, a connectivity score or a centrality value is not a measure of potency, target engagement, dose–response, or chronic toxicity (deAndrés-Galiana et al., 2026; Sedighi et al., 2026; Xie et al., 2025).

With these tensions in mind, this review has four aims. First, we survey the computational approaches that have been applied to ALS drug repurposing, including connectivity mapping, machine-learning feature ensembles, WGCNA, single-cell Mendelian randomization, and AI-based knowledge graphs. Second, we assess the mechanistic rationale and biological plausibility of the leading candidates across the main pathogenic axes of the disease. Third, we examine the evidence gaps that limit translation, particularly cross-tissue divergence, poor cross-platform generalisation, the limits of perturbation datasets, and the failure of many signatures to separate ALS from its mimics. Finally, we outline a translational roadmap that pairs mimic-inclusive modelling with human iPSC-derived motor neuron and organoid systems and with quantitative pharmacokinetic–pharmacodynamic (PK/PD) validation.

2. From Pathobiological Complexity to Computational Target Prioritisation in ALS

2.1. Pathophysiological Complexity and the Case for Repurposing

2.1.1. Clinical and Genetic Heterogeneity

ALS is progressive and, at present, fatal. Its defining feature is the selective degeneration of upper motor neurons in the cerebral cortex and lower motor neurons in the brainstem and spinal cord (Ataei et al., 2026; Feldman et al., 2022). Clinically, this translates into weakness, atrophy, fasciculations, and spasticity, followed by respiratory failure and death, usually within two to five years (Ataei et al., 2026; Pang et al., 2026). About 10% of cases are familial and are driven by variants in genes such as C9orf72, SOD1, TARDBP, and FUS. The other 90% are sporadic, and in these patients disease seems to emerge from an interaction between polygenic susceptibility, environmental exposures, and cellular ageing that is still only partly understood (Ataei et al., 2026; Hardiman et al., 2017).

2.1.2. TDP-43 Proteinopathy as a Convergent Hallmark

If there is a unifying lesion in ALS, it is probably TDP-43 proteinopathy. In over 95% of cases, transactive response DNA-binding protein 43 is cleared from the nucleus, hyperphosphorylated, and deposited in the cytoplasm (Butt et al., 2026; Scotter et al., 2015). Under normal conditions TDP-43 regulates pre-mRNA splicing, RNA transport, stress-granule dynamics, and chromatin organisation (Scotter et al., 2015; Sedighi et al., 2026). Losing its nuclear function while gaining a toxic cytoplasmic one sets off a cascade that includes defective autophagic–lysosomal degradation, disrupted nucleocytoplasmic transport, excitotoxicity, mitochondrial failure, oxidative lipid damage (oxidised phosphatidylcholines, for example), and systemic neuroinflammation (Ataei et al., 2026; Butt et al., 2026; Sedighi et al., 2026). Figure 1 summarises how these genetic and cellular layers converge, and why they sit uneasily with a single-target therapeutic strategy (Figure 1).

2.1.3. The Therapeutic Ceiling of Single-Target AgentsDespite this detailed mechanistic picture, disease-modifying options remain narrow (Liu et al., 2026; Masrori
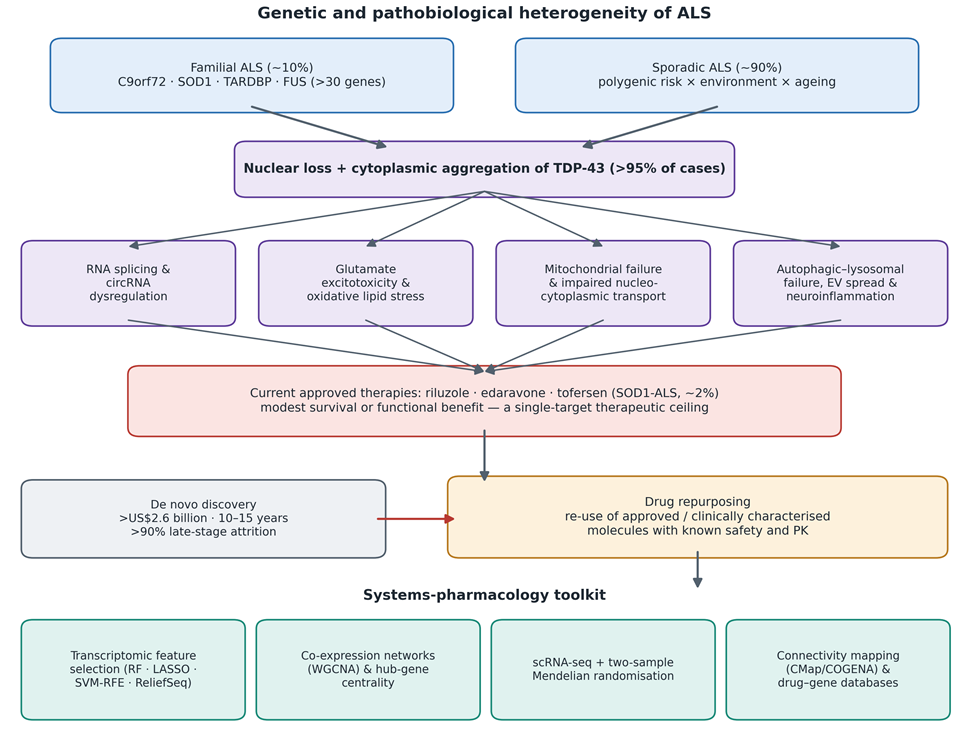
Figure 1. From genetic and pathobiological heterogeneity to the rationale for computational drug repurposing in ALS. Familial (~10%) and sporadic (~90%) ALS converge on nuclear loss and cytoplasmic aggregation of TDP-43, which is present in more than 95% of cases. Downstream, at least four interacting processes (RNA splicing and circRNA dysregulation, excitotoxicity with oxidative lipid stress, mitochondrial and nucleocytoplasmic transport failure, and autophagic–lysosomal failure with extracellular-vesicle spread and neuroinflammation) sustain degeneration. The approved agents act on single nodes and yield modest benefit, while de novo discovery is slow, costly, and failure-prone. Drug repurposing, supported by a systems-pharmacology toolkit, is therefore proposed as a multi-target alternative. Constructed from Ataei et al. (2026), Butt et al. (2026), Feldman et al. (2022), Hardiman et al. (2017), Li and Kar (2025), Pushpakom et al. (2019), Scotter et al. (2015), and Sedighi et al. (2026). (Abbreviations: circRNA, circular RNA; CMap, Connectivity Map; COGENA, Co-expressed Gene-set Enrichment Analysis; EV, extracellular vesicle; PK, pharmacokinetics; WGCNA, weighted gene co-expression network analysis.)
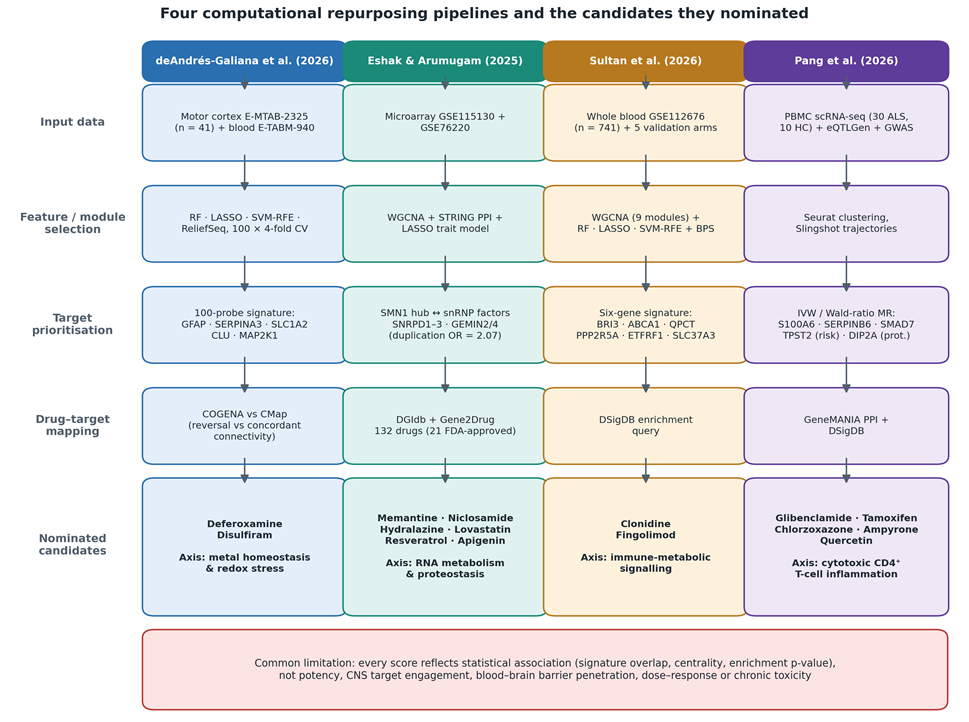
Figure 2. Four computational repurposing pipelines in ALS, from input data to nominated drug candidates. Each lane follows one published pipeline through five stages: input data, feature or module selection, target prioritisation, drug–target mapping, and nominated candidates with their pathogenic axis. The pipelines draw on different tissues (motor cortex, spinal and oculomotor neurons, whole blood, and circulating CD4⁺ cytotoxic T cells), which probably explains why their candidate lists barely overlap. The shared limitation, shown at the bottom, is that every ranking reflects statistical association rather than pharmacological activity. Data from deAndrés-Galiana et al. (2026), Eshak and Arumugam (2025), Pang et al. (2026), and Sultan et al. (2026); details in Table 2. (Abbreviations: BPS, Biomarker Priority Score; CV, cross-validation; DGIdb, Drug–Gene Interaction Database; DSigDB, Drug Signatures Database; HC, healthy controls; IVW, inverse-variance weighted; MR, Mendelian randomization; PPI, protein–protein interaction; RF, random forest.)

& Van Damme, 2020). Riluzole, edaravone, and tofersen extend survival or slow decline only modestly, and tofersen does so only in a small genetic subgroup (Feldman et al., 2022; Miller et al., 2022). The limited efficacy of single-target agents is not surprising, perhaps, given how polygenic and multisystemic the disease appears to be (deAndrés-Galiana et al., 2026; Sultan et al., 2026).

2.1.4. The Economic and Scientific Rationale for Repurposing

Developing a new drug against a single molecular node is estimated to cost more than US$2.6 billion, take 10 to 15 years, and fail more than 90% of the time in late-stage trials (Li & Kar, 2025; Pushpakom et al., 2019). Against that background, drug repurposing (finding new indications for approved or clinically characterised compounds) has become an obvious strategy to pursue (deAndrés-Galiana et al., 2026; Li & Kar, 2025). It sidesteps much of the early safety and pharmacokinetic work and can shorten timelines and costs substantially (Li & Kar, 2025; Pushpakom et al., 2019). Computational systems biology, in turn, offers a way to match multi-target drug profiles to the polygenic landscape of ALS, at least in principle (deAndrés-Galiana et al., 2026; Eshak & Arumugam, 2025).

2.2. Computational Paradigms in Systems Pharmacology and Target Prioritisation

Contemporary repositioning no longer waits for a fortunate clinical observation. It combines multi-omics profiling, machine-learning ensembles, network topology, and AI to look for druggable modules systematically (Li & Kar, 2025; Sultan et al., 2026; Xie et al., 2025). The four pipelines that have been applied most fully to ALS are set out side by side in Figure 2, and their datasets, algorithms, and outputs are detailed in Table 2 (Figure 2; Table 2).

2.2.1. Transcriptomic Signature Extraction and Machine-Learning Ensembles

High-throughput transcriptomics of motor cortex and of peripheral blood captures disease-associated changes in gene expression (deAndrés-Galiana et al., 2026; Sultan et al., 2026). The difficulty lies in separating a genuine signal from noise and overfitting. To reduce this risk, investigators have turned to consensus pipelines that combine several algorithms, typically random forest, LASSO regression, SVM-RFE, and ReliefSeq, and retain only those genes that recur across repeated cross-validation folds (deAndrés-Galiana et al., 2026; Sultan et al., 2026). deAndrés-Galiana et al. (2026), for example, applied this approach to post-mortem motor cortex (E-MTAB-2325) and blood (E-TABM-940) and prioritised 100 recurrent features with classification accuracies above 90%. Sultan et al. (2026) used a triple-consensus pipeline (random forest, LASSO, SVM-RFE) on 741 whole-blood samples (GSE112676) and derived a six-gene signature: BRI3, ABCA1, QPCT, PPP2R5A, ETFRF1, and SLC37A3.

2.2.2. Connectivity Mapping and Directional Interpretation

Turning a disease signature into a therapeutic hypothesis requires a reference of drug effects. CMap catalogues the expression changes that thousands of small molecules induce in reference cell lines, and enrichment engines such as COGENA can query candidate gene sets against it (deAndrés-Galiana et al., 2026; Jia et al., 2016). Direction matters a great deal here, and it is easy to get wrong. Reversal-compatible connectivity arises when a drug upregulates genes that are downregulated in ALS, or downregulates genes that are upregulated. This inverse pattern suggests that the compound might partly normalise the disease state. Concordant connectivity, in contrast, means that the drug pushes expression in the same direction as the disease. That is more likely to reflect a shared stress response than any therapeutic potential (deAndrés-Galiana et al., 2026).

2.2.3. Network Pharmacology and WGCNA Hub-Gene Selection

WGCNA shifts attention away from individual differentially expressed genes and toward co-expression modules (Eshak & Arumugam, 2025; Sultan et al., 2026). By relating modules to clinical traits and ranking genes by intramodular connectivity (kME), degree, and betweenness centrality, it identifies hub genes that appear to coordinate network behaviour (Eshak & Arumugam, 2025; Li & Kar, 2025). These hubs can then be fed into DGIdb and Gene2Drug to build drug–target networks and rank approved drugs by their interactions with key proteins (Eshak & Arumugam, 2025).

2.2.4. Single-Cell Transcriptomics and Mendelian Randomization

Bulk transcriptomics averages over many cell types, which can obscure exactly the populations that matter. Single-cell RNA sequencing (scRNA-seq) avoids this. In ALS, scRNA-seq of peripheral blood has revealed an expansion of CD4⁺ cytotoxic T cells relative to healthy controls, pointing to a peripheral contribution to neuroinflammation (Pang et al., 2026). The obvious next question is whether the genes that mark these cells are causes or consequences. Two-sample Mendelian randomization offers one way to address it. Using cis-expression quantitative trait loci (cis-eQTLs) as instruments, together with genome-wide association study (GWAS) summary statistics, inverse-variance weighted (IVW) and Wald-ratio estimators test whether genetically predicted changes in expression alter ALS risk (Pang et al., 2026).

2.3. Mechanistic Axes and Prioritised Repurposing Candidates

Taken together, these workflows have nominated candidates along four broad biological axes (Figure 2; Table 2).

2.3.1. Metal Homeostasis and Redox Regulation

Iron and copper accumulate abnormally in central motor pathways in ALS, and this appears to accelerate Fenton-type generation of reactive oxygen species, lipid peroxidation, and motor neuron death (deAndrés-Galiana et al., 2026). Serum trace-element profiling also suggests a systemic dimension to this imbalance (H. Wang et al., 2026; Table 1). In the motor cortex dataset E-MTAB-2325, deferoxamine, an approved iron chelator, and disulfiram showed the strongest reversal-compatible signatures (deAndrés-Galiana et al., 2026). Deferoxamine reduces intracellular iron load and limits lipid peroxidation, and related iron chelators have protected motor neurons in SOD1G93A mice (deAndrés-Galiana et al., 2026; Q. Wang et al., 2011). Disulfiram influences metal biology and cellular stress responses and may therefore address the astrocytic and inflammatory changes marked by GFAP, SERPINA3, and the glutamate transporter SLC1A2 (deAndrés-Galiana et al., 2026).

2.3.2. The SMN1 and RNA Metabolism Axis

Mutations in survival motor neuron 1 (SMN1) cause spinal muscular atrophy, but SMN1 duplications are also associated with sporadic ALS (odds ratio [OR] = 2.07) (Eshak & Arumugam, 2025). Network and protein–protein interaction analyses of GSE115130 and GSE76220 placed SMN1 at the centre of a module containing spliceosomal assembly factors (SNRPD1, SNRPD2, SNRPD3, GEMIN2, GEMIN4). A DGIdb query returned 132 drugs that interact with SMN1, 21 of them approved. Gene2Drug analysis suggested that memantine, niclosamide, hydralazine, leflunomide, lovastatin, and trazodone, together with resveratrol, chrysin, apigenin, and genistein, converge on snRNP biogenesis, RNA processing, and protein quality control (Eshak & Arumugam, 2025). Memantine is perhaps the most interesting of these, since it could plausibly act twice over, limiting excitotoxic calcium entry while also supporting SMN1-dependent RNA stability (Eshak & Arumugam, 2025).

2.3.3. Immune-Metabolic and Vascular Modulators

The six-gene whole-blood signature (GSE112676 and GSE112680) appears to reflect systemic metabolic and immune changes rather than neuronal loss as such (Sultan et al., 2026). Its members have intriguing functions. ABCA1 mediates cholesterol efflux; QPCT generates pyroglutamate-modified, aggregation-prone proteins; PPP2R5A regulates protein phosphatase 2A, the main enzyme that dephosphorylates TDP-43; and ETFRF1 influences mitochondrial fatty-acid oxidation. A Drug Signatures Database (DSigDB) query nominated clonidine, an α₂-adrenergic agonist that dampens peripheral immune activation and cytokine release, and fingolimod, a sphingosine-1-phosphate (S1P) receptor modulator that alters lymphocyte trafficking and sphingolipid signalling (Sultan et al., 2026).

2.3.4. Cytotoxic T-Cell Immunomodulators

Combining scRNA-seq with two-sample Mendelian randomization, Pang et al. (2026) identified five genes in CD4⁺ cytotoxic T cells with apparent causal effects: S100A6, SERPINB6, SMAD7, TPST2, and DIP2A. S100A6, a calcium-binding protein upregulated in ALS, promotes SOD1 aggregation and activates pro-inflammatory p38/MAPK signalling. DIP2A, in contrast, seems to be protective. DSigDB mapping prioritised glibenclamide (an ATP-sensitive potassium channel inhibitor), tamoxifen, chlorzoxazone, ampyrone, and quercetin as compounds that might act on these T-cell drivers (Pang et al., 2026).

2.4. Evidence Gaps, Methodological Bottlenecks, and Translational ChallengesThe list of candidates is growing, but the path from list to trial remains poorly lit. Four gaps recur across the
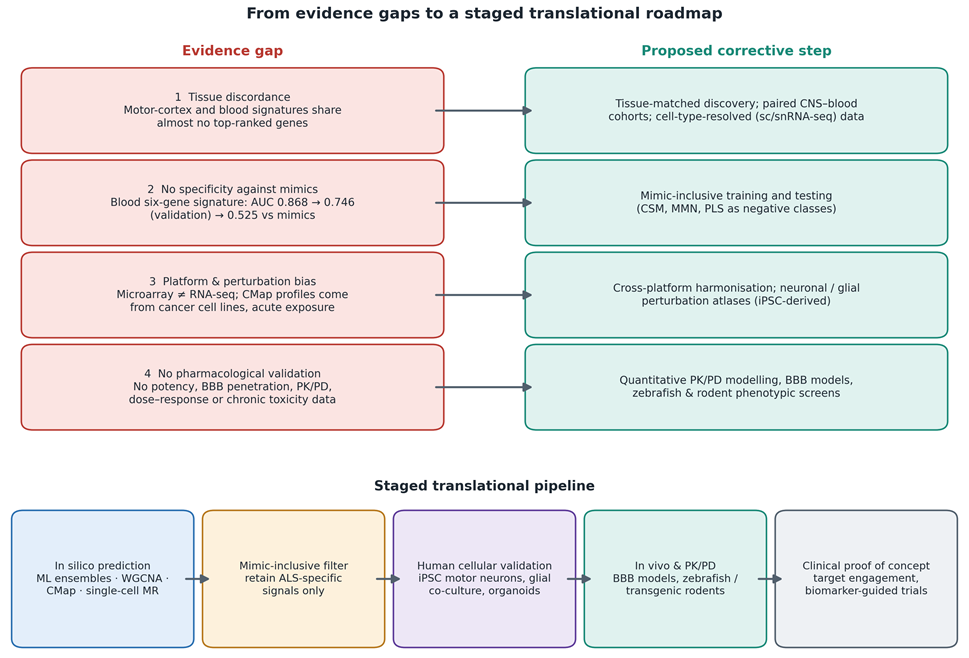
Figure 3. Translational evidence gaps in computational ALS repurposing and a staged roadmap for closing them. The upper panel pairs each of the four recurring evidence gaps (tissue discordance, lack of specificity against disease mimics, platform and perturbation-database bias, and absent pharmacological validation) with a proposed corrective step. The lower panel arranges these steps into a staged pipeline, moving from in silico prediction through a mimic-inclusive filter, human cellular validation, and in vivo PK/PD work to biomarker-guided clinical proof of concept. Candidates that fail at any stage would be returned for re-evaluation rather than advanced. Based on deAndrés-Galiana et al. (2026), Sedighi et al. (2026), Sultan et al. (2026), and Williams and Hong (2016). (Abbreviations: AUC, area under the ROC curve; BBB, blood–brain barrier; CSM, cervical spondylotic myelopathy; iPSC, induced pluripotent stem cell; MMN, multifocal motor neuropathy; PK/PD, pharmacokinetic–pharmacodynamic; PLS, primary lateral sclerosis.)
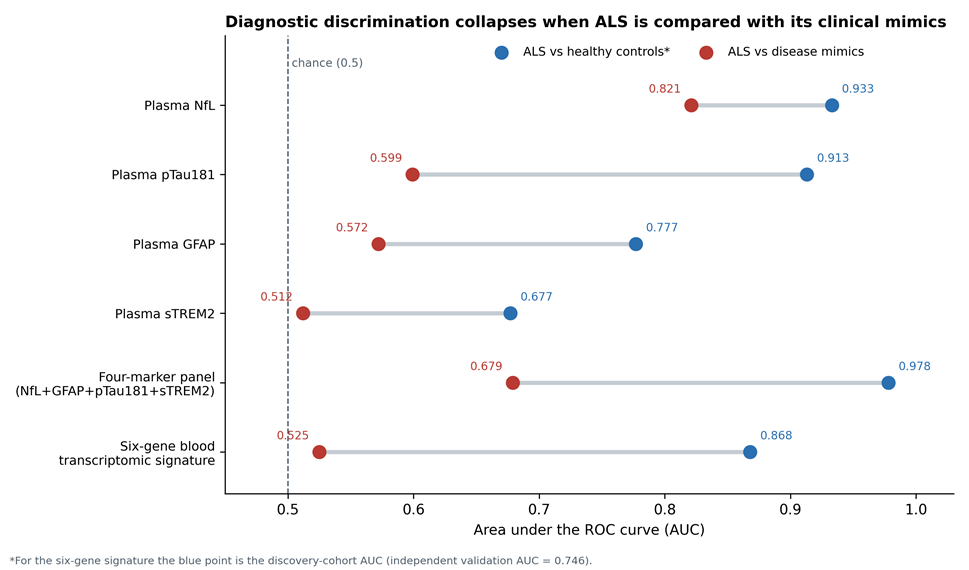
Figure 4. Loss of diagnostic discrimination when ALS is compared with disease mimics rather than healthy controls. Paired AUC values are shown for plasma biomarkers and for a whole-blood transcriptomic signature. Blue points give discrimination of ALS from healthy controls; red points give discrimination from clinical mimics. The dashed line marks chance (AUC = 0.5). Every measure loses accuracy against mimics, and sTREM2 and the six-gene signature fall to near chance, whereas NfL retains moderate discrimination. For the six-gene signature, the blue point is the discovery-cohort AUC (independent validation AUC = 0.746). Values are taken directly from Senerchia et al. (2026a) for the plasma biomarkers and from Sultan et al. (2026) for the transcriptomic signature, and no new data were generated. (Abbreviations: GFAP, glial fibrillary acidic protein; NfL, neurofilament light chain; pTau181, tau phosphorylated at threonine 181; ROC, receiver operating characteristic; sTREM2, soluble triggering receptor expressed on myeloid cells 2.)

literature, and each suggests a corrective step (Figure 3).

2.4.1. Anatomical and Tissue Discordance

Perhaps the most striking finding is how little CNS and blood transcriptomes have in common (deAndrés-Galiana et al., 2026; Sultan et al., 2026). When the top-ranked signatures from motor cortex and whole blood were compared directly, they showed almost no gene-level overlap (deAndrés-Galiana et al., 2026). Motor-cortex profiles capture astroglial support, glutamate handling (SLC1A2), and inclusion dynamics. Blood profiles capture systemic immune activation, mitochondrial stress, and cytokine signalling. It follows that a drug nominated from blood could act on peripheral inflammation without touching cortical degeneration at all.

2.4.2. Failure to Distinguish ALS from Its Mimics

Most computational models are trained to separate ALS from healthy controls (Sultan et al., 2026). This is a much easier task than the one clinicians actually face. When the six-gene blood signature was applied to ALS mimics, including cervical spondylotic myelopathy, multifocal motor neuropathy, and primary lateral sclerosis, its performance fell to near chance (AUC = 0.525) (Sultan et al., 2026). The same pattern appears with fluid biomarkers, where sTREM2 performs modestly against controls but not at all against mimics (Senerchia et al., 2026a; Figure 4; Table 1). Because progressive motor impairment and secondary inflammation are shared across many motor neuron disorders, blood signatures may be recording a generic injury response rather than ALS-specific biology (Sultan et al., 2026). Mimic cohorts need to be built into model training, not added as an afterthought.

2.4.3. Cross-Platform and Perturbation-Database Limitations

Signatures optimised on microarrays often fail to validate in RNA-seq cohorts, owing to differences in dynamic range, isoform quantification, and normalisation (Sultan et al., 2026). The perturbation side of the equation has its own weaknesses. CMap profiles were mostly generated in immortalised cancer cell lines under acute exposure (deAndrés-Galiana et al., 2026). These systems cannot reproduce human motor neuron biology, astroglial–microglial crosstalk, or the selectivity of the BBB (deAndrés-Galiana et al., 2026; Sedighi et al., 2026).

2.4.4. Absence of Quantitative Pharmacological Validation

Connectivity metrics, module centrality, and enrichment p values describe statistical association. They do not describe pharmacological efficacy (deAndrés-Galiana et al., 2026; Sultan et al., 2026). Very few in silico studies evaluate CNS target engagement, BBB penetration and central clearance, dose–response relationships and therapeutic windows, or chronic toxicity in relevant models such as patient iPSC-derived motor neurons, brain organoids, or transgenic animals (deAndrés-Galiana et al., 2026; Pushpakom et al., 2019; Williams & Hong, 2016).

2.5. Synthesis and Future Directions

Systems pharmacology, machine learning, and multi-omics have moved ALS repurposing away from ad hoc observation toward something more systematic. Deferoxamine, disulfiram, memantine, clonidine, fingolimod, and glibenclamide now have mechanistic rationales tied to metal toxicity, RNA splicing failure, immune-metabolic strain, and cytotoxic neuroinflammation. Even so, a structured path forward is needed (Figure 3). We would suggest three priorities. The first is mimic-inclusive machine learning, so that ALS-specific targets can be separated from general markers of neurodegeneration. The second is systematic validation in patient-derived iPSC motor neurons, astrocyte co-cultures, and organoids to confirm target engagement and cellular rescue in human tissue. The third is quantitative PK/PD modelling, combined with in vivo screening in zebrafish (Danio rerio) or transgenic mice, to confirm BBB permeability, define safety margins, and optimise dosing before any candidate enters a trial (Williams & Hong, 2016).

3. Methods

3.1. Review Design and Reporting Framework

We designed this work as a structured narrative review with a scoping component. The included studies differ too much in design, tissue source, analytical platform, and outcome (from transcriptomic enrichment scores to ALSFRS-R slopes) for pooled effect estimates to be meaningful. Even so, we wanted the process to be transparent and repeatable, so the search, screening, and data-extraction steps were modelled on the relevant items of the structured statement and its extension for scoping reviews.

3.2. Information Sources

We searched PubMed/MEDLINE, Scopus, and Web of Science Core Collection from database inception to. Because several relevant computational studies had appeared only recently, we also screened the "in press" and "articles in advance" sections of the journals that published the core studies, and we checked the reference lists of all included articles and of key reviews (Feldman et al., 2022; Hardiman et al., 2017; Li & Kar, 2025; Pushpakom et al., 2019; Xie et al., 2025) by hand. Where a study reported a public dataset, we confirmed the accession in the Gene Expression Omnibus (GEO) or ArrayExpress (for example, GSE112676, GSE112680, GSE115130, GSE76220, E-MTAB-2325, and E-TABM-940) so that readers can retrieve the same source data.

3.3. Search Strategy

The search combined three concept blocks with the Boolean operator AND: the disease, the repurposing or computational approach, and the data type. For PubMed, the string was:

("amyotrophic lateral sclerosis"[MeSH] OR "amyotrophic lateral sclerosis"[tiab] OR "motor neuron disease"[tiab] OR ALS[tiab]) AND ("drug repositioning"[MeSH] OR repurpos*[tiab] OR repositio*[tiab] OR "connectivity map"[tiab] OR CMap[tiab] OR "network pharmacology"[tiab] OR WGCNA[tiab] OR "machine learning"[tiab] OR "Mendelian randomization"[tiab] OR "knowledge graph"[tiab] OR "biomarker"[tiab]) AND (transcriptom*[tiab] OR "gene expression"[tiab] OR "single-cell"[tiab] OR "RNA-seq"[tiab] OR microarray[tiab] OR plasma[tiab] OR MRI[tiab] OR trial[tiab])

The string was adapted to the syntax of Scopus (TITLE-ABS-KEY) and Web of Science (TS=). Because we wanted to set the computational predictions against the clinical and biological context in which any repurposed drug would eventually be judged, we ran supplementary searches on four themes: fluid and cellular biomarkers (neurofilament light chain, GFAP, pTau181, sTREM2, extracellular-vesicle TDP-43, trace elements); recent clinical interventions and symptomatic management (randomised trials, sialorrhea radiotherapy, non-invasive ventilation, advance care planning); neuroimaging (choroid plexus, functional connectivity, volumetric segmentation); and epidemiological risk factors. Searches were limited to English-language articles.

3.4. Eligibility Criteria

Studies were eligible if they (a) involved patients with ALS, ALS-derived tissue or biofluids, or ALS-relevant datasets; (b) applied a computational, systems-biology, or machine-learning method to identify therapeutic targets or repurposable drugs, or reported quantitative biomarker, clinical-intervention, neuroimaging, or risk-factor data that bear on how a candidate would be stratified, monitored, or tested; (c) reported enough methodological detail (dataset source, sample size, algorithm, and validation strategy) to be appraised; and (d) were published as peer-reviewed original research, systematic reviews, or authoritative narrative reviews. We excluded conference abstracts without full data, preprints that had not been peer reviewed, studies confined to non-ALS motor neuron diseases, and purely in vitro chemistry without an ALS-specific biological readout. Foundational reviews and landmark trials (for example, Miller et al., 2022) were retained as background sources even when they fell outside the primary search window.

3.5. Study Selection

After duplicates were removed, two reviewers independently screened titles and abstracts and then assessed full texts against the eligibility criteria. Disagreements were settled by discussion and, where needed, by a third reviewer. Reasons for exclusion at the full-text stage were recorded. The final evidence base comprised 34 sources: 18 primary studies whose quantitative data were extracted into the evidence tables (Tables 1–4), and 16 further sources (reviews, landmark trials, methodological papers, and supporting primary studies) used to frame the biology, pharmacology, and analytical methods.

3.6. Data Extraction

We extracted data into a piloted, standardised form. For each study we recorded the first author and year; the design; the cohort and sample characteristics (sample sizes by group, diagnostic framework, and country or centre where reported); the data source and accession numbers; the analytical or methodological approach (assay platform, algorithm, software and version, cross-validation scheme, and correction for multiple testing); quantitative findings (effect sizes, odds ratios, hazard ratios, AUCs with 95% confidence intervals, and p values as reported); the prioritised genes, modules, or biomarkers; the nominated drugs and their proposed mechanisms; and the authors' own stated limitations. For computational studies we also noted the direction of connectivity (reversal-compatible or concordant), whether the model had been tested against disease mimics, and whether any experimental or pharmacological validation had been carried out. Numbers were taken directly from the text, tables, or supplements of the source articles and were not recalculated. One reviewer extracted the data and a second checked every entry against the source..

3.7. Appraisal of Methodological Quality

The designs were too varied for a single risk-of-bias tool, so we used a domain-based appraisal instead. For computational studies we asked five questions. Was the source data public and identified by accession? Was feature selection nested within cross-validation to avoid information leakage? Was there independent external validation? Were disease mimics included? Was the direction of drug–disease connectivity interpreted explicitly? For biomarker studies we considered cohort size, the presence of neurological or mimic controls, assay platform, and adjustment for age and sex. For clinical studies we considered randomisation, blinding, the prespecified primary analysis, and the handling of missing data (for example, LOCF versus MMRM). We did not exclude studies on the basis of this appraisal. Instead, it shaped how much weight each finding received in the synthesis and discussion.

3.8. Evidence Synthesis

The synthesis was narrative and thematic. Studies were grouped into four domains: fluid, cellular, and trace-element biomarkers (Table 1); computational systems biology and drug repurposing frameworks (Table 2); clinical interventions and disease management (Table 3); and neuroimaging, risk factors, and functional phenotypes (Table 4). Within the computational domain, we mapped each nominated drug to a pathogenic axis (metal and redox stress, RNA metabolism and proteostasis, immune-metabolic signalling, or cytotoxic T-cell inflammation) and recorded the evidence tier it had reached: signature-level association, causal genetic inference, experimental validation, or clinical testing. Where studies reported diagnostic accuracy both against healthy controls and against disease mimics, we tabulated the paired AUCs to show how much specificity was lost (Figure 4). No statistical pooling was performed.

4. Synthesis of Findings: Biomarker, Computational, Clinical, and Imaging Evidence Across the ALS Translational Continuum

4.1. Overview of the Evidence Base

The studies we reviewed fall fairly naturally into four linked domains. Each answers a different question that a repurposing programme would eventually have to face. The first is fluid, cellular, and trace-element biomarkers, which capture axonal injury, astrogliosis, chronic denervation, microglial activation, and systemic metabolic change (Table 1). The second is computational systems pharmacology, where multi-omics feature selection, co-expression networks, single-cell Mendelian randomization, and connectivity mapping are used to nominate drugs (Table 2; Figure 2). The third is clinical intervention and symptom management, including a recent head-to-head trial, radiotherapy for sialorrhea, adherence to non-invasive ventilation (NIV), and advance care planning (Table 3). The fourth is neuroimaging and epidemiology, covering blood–CSF barrier integrity, cortical functional gradients, compensatory parietal networks, midbrain segmentation pipelines, and head injury as a risk factor (Table 4). One theme cuts across all four. Discriminating ALS from healthy people is relatively easy, but discriminating ALS from conditions that resemble it is much harder (Figure 4).

4.2. Fluid, Cellular, and Trace-Element Biomarkers

4.2.1. Complementary Axes of Neurodegeneration: NfL, pTau181, and GFAPIn a cross-sectional study using ultrasensitive single-molecule array (Simoa) assays in 123 patients with ALS, 46 neurological controls, and 42 healthy controls, three plasma markers turned out to track quite different aspects of the disease (Senerchia et al., 2026b; Table 1). Neurofilament light chain (NfL) was clearly elevated in ALS (73.96 pg/mL vs. 17.02 pg/mL in neurological and 12.73 pg/mL in healthy controls; p < 0.001). In models anchored to transcranial magnetic stimulation and the Penn Upper Motor Neuron Score, NfL independently tracked corticospinal degeneration, progression rate, and upper motor neuron burden (F[3,115] = 3.34, p = 0.022). Phosphorylated tau 181 (pTau181) was also raised (2.67 vs. 1.75 and 0.95 pg/mL; p < 0.001), but it behaved differently. It was highest in lower motor neuron-predominant phenotypes such as progressive muscular atrophy and flail-limb variants, and it correlated with electromyographic markers of chronic denervation rather than corticospinal decline (Senerchia et al., 2026b). This

Table 1. Fluid, cellular, and trace-element biomarkers in amyotrophic lateral sclerosis: cohorts, methods, quantitative findings, and biological interpretation. This table summarises the circulating biomarker studies used in this review to contextualise computational repurposing. Each row gives the cohort, the analytical approach, and the principal quantitative results, together with the biological axis the marker appears to index. Notice that markers performing well against healthy controls can lose most of their discriminative power against disease mimics (see also Figure 4). Values are reported as in the source articles; concentrations are group means or medians as reported. (Abbreviations: ADEV, astrocyte-derived extracellular vesicle; ALSFRS-R, Revised ALS Functional Rating Scale; AUC, area under the ROC curve; cuNfL, cumulative NfL exposure; DPR, disease progression rate; GFAP, glial fibrillary acidic protein; HC, healthy controls; ICP-MS, inductively coupled plasma mass spectrometry; LMN/UMN, lower/upper motor neuron; NC, neurological controls; NfL, neurofilament light chain; OR, odds ratio; pTau181, tau phosphorylated at threonine 181; RF, random forest; sTREM2, soluble triggering receptor expressed on myeloid cells 2.)

Biomarker / target category

Cohort and sample characteristics

Methodological approach

Quantitative findings and statistical thresholds

Biological and clinical significance

Reference

Plasma NfL, GFAP, and pTau181

123 ALS; 46 NC; 42 HC

Simoa digital immunoassay; latent profile analysis; EMG denervation scoring (4 regions); TMS and PUMNS anchoring

NfL 73.96 vs. 17.02 (NC) vs. 12.73 (HC) pg/mL, p < 0.001

pTau181 2.67 vs. 1.75 vs. 0.95 pg/mL, p < 0.001

GFAP 43.30 vs. 28.75 (HC) pg/mL, p = 0.001

Three complementary axes: NfL (axonal / UMN burden), pTau181 (LMN denervation), GFAP (astrogliosis, age, emotional lability); three biological clusters

Senerchia et al. (2026b)

ADEV phosphorylated TDP-43

Whole blood (n = 76) and plasma (n = 86), ALS vs. age- and sex-matched HC; multicentre

Immunoaffinity ADEV enrichment; CD81 normalisation; 5PL ELISA calibration; RF classification

pTDP-43/CD81 higher in ALS plasma (p = 1.4 × 10⁻¹⁰) and blood (p = 0.014)

Adjusted OR 5.0 (95% CI 2.1–12.0) per SD

RF AUC 0.87 (95% CI 0.84–0.91) in plasma

Blood-based readout of TDP-43 proteinopathy; candidate diagnostic and target-engagement biomarker

Butt et al. (2026)

Plasma sTREM2 and multimarker panel

100 ALS; 30 HC; 30 disease mimics

Chemiluminescent immunoassay; ROC analysis with Youden index; multivariable logistic regression

sTREM2 AUC 0.677 (vs. HC), 0.512 (vs. mimics)

NfL AUC 0.933 (vs. HC; cut-off 28.98 pg/mL; sensitivity 81.8%, specificity 100%), 0.821 (vs. mimics; cut-off 33.47 pg/mL)

Four-marker panel AUC 0.978 (vs. HC), 0.679 (vs. mimics)

sTREM2 reflects non-specific neuroimmune activation; NfL is the most robust single marker; panels lose specificity against mimics

Senerchia et al. (2026a)

Serum trace elements (Ca, Mg, Fe, Cu, Zn)

110 patients with sporadic ALS (China)

ICP-MS; Spearman correlation; RF feature-importance ranking

Ca 1.58 mmol/L; Mg 1.67 mmol/L; Fe 9.09 µmol/L; Cu 17.32 µmol/L; Zn 95.66 µmol/L

Higher Mg associated with faster DPR and lower ALSFRS-R (p < 0.05)

Trace-element imbalance may impair metalloenzymes (e.g., SOD1) and promote Fenton-driven oxidative stress

H. Wang et al. (2026)

Longitudinal cumulative NfL exposure (cuNfL)

508 ALS; prospective multicentre cohort (32 Chinese provinces)

K-means clustering of three serial plasma NfL measurements; area-under-the-curve exposure modelling; multivariable regression

Trajectories: low-stable (n = 183), moderate (n = 225), high-progressive (n = 100)

Per-SD cuNfL: adjusted OR 1.99 (95% CI 1.52–2.60; p < 0.001) for 1-year adverse events

Longitudinal NfL trajectories stratify prognostic risk better than a single baseline value

Khalil et al. (2024); Senerchia et al. (2026b)

Table 2. Computational systems biology, multi-omics, and drug repurposing frameworks applied to amyotrophic lateral sclerosis. The four computational pipelines reviewed here are compared by input data, algorithmic workflow, prioritised genes or modules, and nominated drugs. Each pipeline samples a different tissue (motor cortex, whole blood, circulating T cells, or spinal and oculomotor neurons), which largely explains why their candidate lists do not overlap (Figure 2). All drug nominations rest on statistical association (connectivity, enrichment, or interaction mapping); none has yet been validated pharmacologically in ALS models. (Abbreviations: BPS, Biomarker Priority Score; CMap, Connectivity Map; COGENA, Co-expressed Gene-set Enrichment Analysis; CV, cross-validation; DGIdb, Drug–Gene Interaction Database; DSigDB, Drug Signatures Database; FDR, false discovery rate; HC, healthy controls; IVW, inverse-variance weighted; LASSO, least absolute shrinkage and selection operator; MR, Mendelian randomization; PPI, protein–protein interaction; RF, random forest; SVM-RFE, support vector machine recursive feature elimination; WGCNA, weighted gene co-expression network analysis.)

Computational approach

Datasets and sample size

Algorithmic and analytical workflow

Prioritised genes and molecular modules

Nominated drug candidates and mechanism

Reference

Transcriptome-wide machine-learning consensus with COGENA

Motor cortex E-MTAB-2325 (n = 41; 31 sALS, 10 HC); blood E-TABM-940

Four feature-selection tools (RF, LASSO, SVM-RFE, ReliefSeq) over 100 repetitions of four-fold CV; COGENA pathway enrichment; CMap perturbation profiling

100-probe motor-cortex signature including SERPINA3, MAP2K1, CLU, PTN, GFAP, SLC1A2, EEF1D, ACTB, SAFB (glutamate handling, astrocytic stress, proteostasis)

Deferoxamine and disulfiram: strongest reversal-compatible signatures (−log₂[FDR] ≈ 7.7); iron chelation, oxidative stress, neuroinflammation

Concordant (non-therapeutic): ciprofloxacin, prochlorperazine, androsterone

deAndrés-Galiana et al. (2026)

Multi-phase transcriptomics with Biomarker Priority Scoring

Discovery whole blood GSE112676 (n = 741); five validation arms across three external cohorts (n = 705), including GSE112680 (n = 301)

WGCNA (nine modules); triple-consensus ML (RF, LASSO, SVM-RFE); BPS; DSigDB drug query

Six-gene signature: BRI3, ABCA1, QPCT, PPP2R5A, ETFRF1, SLC37A3

Discovery AUC 0.868; validation AUC 0.746; AUC 0.525 vs. disease mimics

Clonidine (p = 2.29 × 10⁻⁴) and fingolimod (p = 3.30 × 10⁻³): α₂-adrenergic immunomodulation and S1P receptor-mediated lymphocyte trafficking

Sultan et al. (2026)

Single-cell RNA-seq with two-sample Mendelian randomization

PBMC scRNA-seq (30 ALS, 10 HC); cis-eQTLs from eQTLGen (n = 31,684); GWAS summary data (n = 218,741)

Seurat clustering; Slingshot trajectory modelling; IVW and Wald-ratio MR; GeneMANIA PPI; DSigDB target mapping

Expanded CD4⁺ cytotoxic T cells

Causal genes: S100A6 (OR 1.296, p = 0.015), SERPINB6 (OR 1.056), SMAD7, TPST2 (risk); DIP2A (OR 0.915, p = 0.043; protective)

Glibenclamide, tamoxifen, chlorzoxazone, ampyrone, quercetin: proposed inhibition of S100A6/p38-MAPK inflammatory signalling in cytotoxic T cells

Pang et al. (2026)

Integrative WGCNA with target–drug interaction mapping

GEO microarrays GSE115130 (12,649 genes) and GSE76220 (10,675 genes)

WGCNA module detection; STRING PPI network; LASSO trait prediction; DGIdb and Gene2Drug pathway-tree analysis

SMN1 as central druggable hub in sporadic ALS (OR 2.07 for duplications), linked to snRNP factors SNRPD1–3, GEMIN2, GEMIN4

132 SMN1-interacting drugs (21 FDA-approved): memantine, niclosamide, hydralazine, leflunomide, lovastatin, trazodone, resveratrol and other polyphenols converging on snRNP biogenesis and RNA processing

Eshak & Arumugam (2025)

fits with the detection of pTau181 and pTau217 in the serum and skeletal muscle of patients with ALS, which hints at a peripheral, possibly muscular, origin (Abu-Rumeileh et al., 2025). Glial fibrillary acidic protein (GFAP) was elevated as well (43.30 vs. 28.75 pg/mL; p = 0.001), yet it seemed largely independent of motor neuron loss. Instead, it was associated with age, female sex, and emotional lability on the Center for Neurologic Study-Lability Scale (F[1,106] = 10.27, p = 0.002). Latent profile analysis combined the three markers into three clusters: a low-burden, slowly progressing group; a lower motor neuron-dominant group with high pTau181; and an aggressive group with high NfL and GFAP (Senerchia et al., 2026b).

4.2.2. Astrocyte-Derived Extracellular Vesicle TDP-43

Detecting central TDP-43 pathology in blood has long been a goal. Butt et al. (2026) came closer to it by isolating astrocyte-derived extracellular vesicles (ADEVs) from whole blood (n = 76) and plasma (n = 86) across several centres, and normalising phosphorylated TDP-43 (pSer409) to the vesicle marker CD81 to correct for variation in isolation yield. The pTDP-43/CD81 ratio was markedly higher in ALS plasma than in matched controls (p = 1.4 × 10⁻¹⁰). Each standard-deviation increase was associated with a five-fold rise in the adjusted odds of ALS (OR = 5.0; 95% CI 2.1–12.0), and a cross-validated random-forest model reached an AUC of 0.87 (95% CI 0.84–0.91) in plasma (Table 1). If these results replicate, ADEV pTDP-43 could serve both as a diagnostic marker and, perhaps more usefully for repurposing, as a peripheral readout of target engagement.

4.2.3. Microglial Activation and the Limits of Specificity: sTREM2

The sTREM2 data are instructive precisely because they are disappointing. Across 100 patients with ALS, 30 healthy controls, and 30 disease mimics, plasma soluble TREM2 was higher in ALS than in controls (p = 0.013) but did not differ between ALS and mimics (p = 0.394) (Senerchia et al., 2026a). Its AUC was 0.677 against controls and 0.512 against mimics, which is essentially chance. NfL performed far better (AUC = 0.933 vs. controls; 0.821 vs. mimics). A four-marker panel (sTREM2, NfL, GFAP, pTau181) reached an AUC of 0.978 against controls, but only 0.679 against mimics (Figure 4; Table 1). sTREM2 therefore seems to report general neuroimmune activation rather than anything specific to ALS (Senerchia et al., 2026a). Assay platform may also matter in these comparisons, since different serum NfL immunoassays do not perform identically in ALS (Mondesert et al., 2025).

4.2.4. Trace Elements and Longitudinal NfL Trajectories

Serum trace elements measured by inductively coupled plasma mass spectrometry in 110 Chinese patients with sporadic ALS showed mean concentrations of 1.58 mmol/L for calcium, 1.67 mmol/L for magnesium, 9.09 µmol/L for iron, 17.32 µmol/L for copper, and 95.66 µmol/L for zinc (H. Wang et al., 2026). Magnesium stood out. Higher levels were associated with faster progression and lower ALSFRS-R scores (p < 0.05), which the authors linked to metalloenzyme dysfunction, including that of SOD1, and to Fenton-driven oxidative stress (Table 1). A prospective multicentre study of 508 patients took a longitudinal view, deriving cumulative NfL exposure (cuNfL) from three serial plasma measurements (Khalil et al., 2024; Senerchia et al., 2026b). K-means clustering separated low-stable (n = 183), moderate (n = 225), and high-progressive (n = 100) trajectories. Each 1-SD increase in cuNfL nearly doubled the risk of an adverse event within a year (adjusted OR = 1.99; 95% CI 1.52–2.60; p < 0.001), which suggests that NfL trajectories stratify risk better than a single baseline value (Table 1).

4.3. Computational Systems Pharmacology and Target Discovery

4.3.1. Transcriptome-Wide Consensus Machine Learning and Connectivity MappingdeAndrés-Galiana et al. (2026) ran a repeated cross-validation consensus pipeline (random forest, LASSO, SVM-RFE, ReliefSeq; 100 repetitions of four-fold cross-validation) on motor cortex (E-MTAB-2325; n = 41) and whole blood (E-TABM-940). The recurrent signatures classified samples with accuracies of at least 0.90. The motor-cortex signature of 100 probes included SERPINA3, MAP2K1, CLU, PTN, GFAP, and SLC1A2, genes involved in glutamate handling, astrocytic stress, and proteostasis (Table 2). When these gene sets were queried through COGENA against CMap, deferoxamine and disulfiram gave the strongest reversal-compatible enrichment (−log₂[FDR] ≈ 7.7) among genes downregulated in ALS. By contrast, ciprofloxacin, prochlorperazine, and androsterone showed concordant connectivity, which is

Table 3. Clinical interventions, disease management, and symptom control in amyotrophic lateral sclerosis. This table collects recent clinical evidence against which any repurposed agent would ultimately be judged, from a head-to-head phase II trial to supportive and palliative care. The HLSJ trial illustrates how the choice of primary analysis (LOCF vs. MMRM) can change a conclusion, and the NIV and ACP studies show that adherence and timing are major determinants of outcome. Samples in several studies are small, so the findings should be read as hypothesis-generating. (Abbreviations: ACP, advance care planning; ALSFRS-R, Revised ALS Functional Rating Scale; CI, confidence interval; HLSJ, Huoling Shengji granules; HR, hazard ratio; IQR, interquartile range; LOCF, last observation carried forward; LSMD, least-squares mean difference; MMRM, mixed model for repeated measures; NIMV/NIV, non-invasive (mechanical) ventilation; PEG, percutaneous endoscopic gastrostomy; VMAT, volumetric modulated arc therapy.)

Clinical intervention

Study design and cohort size

Intervention protocol / assessment metrics

Primary efficacy and clinical outcomes

Safety, toxicity, or prognostic factors

Reference

Huoling Shengji granules (HLSJ) vs. riluzole

Multicentre, randomised, double-blind, double-dummy, active-controlled phase II trial; n = 140 across 11 Chinese centres

HLSJ (n = 71) vs. riluzole 100 mg/day (n = 69) for 48 weeks; primary end point: change in ALSFRS-R (LOCF); MMRM as supportive analysis

LOCF: numerical benefit of 1.07 points (−10.46 vs. −11.53; p = 0.3674)

MMRM: LSMD 2.29 points (95% CI 0.52–4.06; p = 0.0114)

Age ≤ 65 years (n = 128): LSMD 2.88 (95% CI 1.02–4.73; p = 0.0025)

ROADS difference 4.80 (p = 0.0233)

Adverse events 80.28% vs. 80.56% (p = 0.9671); no drug-related deaths or grade ≥ 3 toxicity with HLSJ; supports a phase III trial in patients aged ≤ 65 years

Liu et al. (2026)

Radiotherapy (VMAT) for refractory sialorrhea

Single-centre case series with critical review; n = 6 patients with bulbar ALS

Parotid and submandibular irradiation, 20 Gy in 5 fractions; 6-MV VMAT (n = 5) vs. bilateral 16-MeV electrons (n = 1)

Satisfactory response in 5/6 (83.3%); mean subjective salivation reduction 60% (range 50%–90%); ≥ 2-point gain in ALSFRS-R saliva item

Two patients stopped anticholinergics

VMAT lowered mean dose to oral cavity (7.8 vs. 9.0 Gy) and larynx (6.0 vs. 9.0 Gy); no grade 2 mucositis or acute parotitis

Zhang et al. (2026)

Time-dependent adherence to NIV

Longitudinal observational cohort; n = 73 patients prescribed NIV (CRESLA, Italy)

Telemetric monitoring of daily NIV use at 1, 3, 6, and 12 months; adherence ≥ 4 h/night; multivariable Cox modelling

Use increased over time, but ~30% non-adherent at 6 and 12 months

Lower non-adherence with higher baseline ALSFRS-R respiratory subscore (OR 0.78, p = 0.02) and a male caregiver (OR 0.19, p = 0.03)

PEG independently associated with >3-fold risk of death or tracheostomy (HR 3.42; 95% CI 1.54–7.59; p = 0.002)

Riva-Rovedda et al. (2026)

Timing of advance care planning (ACP)

Retrospective population-based ALS cohort

Longitudinal tracking of ACP initiation and completion, ventilation choices, and end-of-life decision timelines

Median symptom onset to ACP completion 16.4 months (IQR 8.3–27.8)

Median NIMV start to ACP completion 5.42 months (IQR 1.4–12.8)

ACP is completed late; structured palliative discussions should begin before respiratory decline

Moglia et al. (2023)

Table 4. Neuroimaging phenotypes, cortical organisation, and epidemiological risk factors in amyotrophic lateral sclerosis. This table summarises imaging and epidemiological studies that could inform patient stratification and the choice of end points in future repurposing trials. Choroid plexus volume offers a structural marker of central neuroinflammation, whereas functional gradient and parietal connectivity changes suggest adaptive network reorganisation. The divergence between T1- and T2-based midbrain pipelines cautions against treating imaging end points as method-independent, and the head-injury meta-analysis supports a multistep model of disease. (Abbreviations: AAL, Automated Anatomical Labeling; CHIT1, chitotriosidase-1; CI, confidence interval; CP, choroid plexus; FC, functional connectivity; FDR, false discovery rate; FPN, frontoparietal network; GMM, Gaussian mixture model; HC, healthy controls; IL-6, interleukin-6; OR, odds ratio; RN, red nucleus; ROI, region of interest; rs-fMRI, resting-state functional MRI; SMN, sensorimotor network; SN, substantia nigra; SPL, superior parietal lobule; THI, traumatic head injury; VN, visual network.)

Research domain

Cohort and diagnostic framework

Neuroimaging / epidemiological methodology

Key quantitative findings and statistical estimates

Clinical and mechanistic conclusions

Reference

Choroid plexus enlargement and CSF neuroinflammation

161 newly diagnosed sporadic ALS and 64 HC; longitudinal subset n = 42; baseline CSF n = 38

3T T1-weighted MRI; automated Bayesian GMM segmentation of CP; CSF CHIT1 and IL-6 immunoassay

CP enlarged in ALS at all King's stages (p < 0.05, Bonferroni), largest at stage 3

Significant longitudinal expansion

CSF CHIT1 (β = 0.456, p < 0.001) and IL-6 (β = 0.348, p = 0.01) independently predicted CP volume

CP enlargement is a progressive imaging marker of blood–CSF barrier disruption and neuroinflammation

Ma et al. (2026)

Functional connectivity gradients and cortical hierarchy

17 ALS vs. 29 HC

rs-fMRI; non-linear diffusion-map embedding; principal gradient analysis; discriminant modelling

Compression of principal gradient (p < 0.05, FDR)

SMN (r = 0.506, p = 0.038) and VN (r = 0.534, p = 0.027) gradients elevated

FPN reduced (r = −0.792, p < 0.001)

Discriminant AUC 0.712–0.866

Macroscale cortical hierarchy is compressed in ALS; gradient metrics may serve as objective imaging markers

Cai et al. (2026)

Longitudinal reorganisation of SPL networks

ALS n = 14 at baseline, n = 10 at 5-month follow-up; HC n = 14

rs-fMRI seed-to-ROI FC; CONN toolbox with AAL SPL seed; FDR correction (p < 0.05); ALSFRS-R tracking

Right SPL hyperconnectivity with visual regions: occipital fusiform gyrus β 0.31 → 0.41; lingual gyrus β 0.30 → 0.36; visual networks β 0.28 → 0.35 (p-FDR < 0.05)

ALSFRS-R 41.71 → 37.40

Progressive parieto-occipital strengthening suggests compensatory sensorimotor reorganisation

Ghaderi et al. (2026)

Midbrain subcortical volumetric pipelines

31 ALS vs. 21 non-neurodegenerative controls

Head-to-head comparison of T1-weighted (OpenMAP-T1) and T2-weighted (pBrain) segmentation of RN and SN

No RN or SN volume loss in ALS (p = 0.829)

T2 pipeline detected age-related RN atrophy (p = 0.001; missed by T1, p = 0.116); T1 pipeline detected age-related SN loss (p = 0.026)

T1 and T2 pipelines index different tissue properties (myelin vs. iron) and are not interchangeable

Mohammadi et al. (2026)

Traumatic head injury as a risk factor

Meta-analysis of 17 studies; 578,815 participants (Europe and the Americas)

Systematic review; random-effects unadjusted and adjusted OR models; subgroup analysis by sex and frequency

Overall adjusted OR 1.47 (95% CI 1.23–1.76; p < 0.001)

Men OR 2.27 (95% CI 1.41–3.66); women OR 1.30 (95% CI 0.78–2.17)

Single THI OR 1.48; multiple THI OR 1.34

No dose–response gradient; THI more likely a trigger or co-factor than a primary cause

Toubasi & Al-Sayegh (2026)

more consistent with a shared stress response than with any therapeutic reversal (Figure 2; Table 2).

4.3.2. Multi-Phase Transcriptomics and Biomarker Priority Scoring

Sultan et al. (2026) described their framework as leakage-free, and the design supports that claim reasonably well. In the discovery whole-blood dataset GSE112676 (n = 741), 976 genes were differentially expressed. WGCNA identified nine modules, of which the brown module was most strongly associated with disease (r = 0.368, p < 0.0001). A triple-consensus pipeline combined with a Biomarker Priority Score produced the six-gene signature (BRI3, ABCA1, QPCT, PPP2R5A, ETFRF1, SLC37A3). Its AUC was 0.868 (95% CI 0.835–0.897) in discovery and 0.746 in independent validation (GSE112680; n = 301). Against disease mimics, however, it fell to 0.525 (Figure 4; Table 2). This is probably the single most important number in the computational literature, because it indicates that the blood signature captures an immune-metabolic response common to many motor neuron disorders. A DSigDB query nominated clonidine (p = 2.29 × 10⁻⁴) and fingolimod (p = 3.30 × 10⁻³) (Sultan et al., 2026).

4.3.3. Single-Cell RNA-Seq and Two-Sample Mendelian Randomization

Pang et al. (2026) sequenced PBMCs from 30 patients and 10 controls and found a selective expansion of CD4⁺ cytotoxic T cells in ALS (p < 0.05). They then combined the differentially expressed genes of these cells with cis-eQTL data (n = 31,684) and GWAS summary statistics (n = 218,741) in an IVW Mendelian randomization framework. Five genes emerged as putatively causal. S100A6 (OR = 1.296, p = 0.015), SERPINB6 (OR = 1.056), SMAD7, and TPST2 appeared to increase risk, whereas DIP2A (OR = 0.915, p = 0.043) appeared protective (Table 2). GeneMANIA interaction mapping and DSigDB queries prioritised glibenclamide, tamoxifen, chlorzoxazone, ampyrone, and quercetin as molecules that might inhibit S100A6-driven p38/MAPK signalling in circulating cytotoxic lymphocytes (Figure 2).

4.3.4. WGCNA Co-expression and the SMN1 Hub Network

In spinal cord and oculomotor neuron microarray datasets (GSE115130 and GSE76220), WGCNA and LASSO regression pointed to SMN1 as a central druggable hub in sporadic ALS (OR = 2.07 for duplications) (Eshak & Arumugam, 2025). SMN1 sat in a dense cluster with snRNP assembly factors (SNRPD1, SNRPD2, SNRPD3, GEMIN2, GEMIN4). DGIdb returned 132 interacting compounds, 21 of them approved. Gene2Drug analysis suggested that memantine, niclosamide, hydralazine, leflunomide, lovastatin, and trazodone, along with resveratrol, chrysin, apigenin, and genistein, converge on Gene Ontology pathways for snRNP biogenesis, RNA processing, and protein quality control (Table 2).

4.4. Clinical Interventions, Symptom Control, and Patient Management

4.4.1. Huoling Shengji Granules versus Riluzole

In a multicentre, randomised, double-blind, double-dummy phase II trial across 11 Chinese centres, 140 patients were assigned 1:1 to Huoling Shengji granules (HLSJ; n = 71) or riluzole 100 mg/day (n = 69) for 48 weeks (Liu et al., 2026; Table 3). The prespecified primary analysis (full analysis set, last observation carried forward) showed a numerical advantage of 1.07 ALSFRS-R points for HLSJ (−10.46 vs. −11.53; p = 0.3674), which did not meet the threshold for superiority. A mixed model for repeated measures (MMRM), reported as a post hoc analysis, suggested slower decline with HLSJ (least-squares mean difference [LSMD] = 2.29 points; 95% CI 0.52–4.06; p = 0.0114), and the difference was larger in patients aged 65 years or younger (n = 128; LSMD = 2.88; 95% CI 1.02–4.73; p = 0.0025). Scores on the Rasch-Built Overall ALS Disability Scale at week 48 also favoured HLSJ (difference = 4.80; p = 0.0233). Adverse-event rates were similar (80.28% vs. 80.56%; p = 0.9671), and there were no drug-related deaths or grade ≥ 3 toxicities in the HLSJ arm.

4.4.2. Radiotherapy for Refractory Sialorrhea

In six patients with bulbar ALS and medically refractory sialorrhea, parotid and submandibular glands were irradiated to 20 Gy in five fractions, using 6-MV volumetric modulated arc therapy (VMAT) in five patients and bilateral 16-MeV electron fields in one (Zhang et al., 2026). Five of six (83.3%) had a satisfactory response, with a mean subjective reduction in salivation of 60% (range 50%–90%) and an improvement of at least two points on the ALSFRS-R saliva item. Two patients stopped anticholinergic medication altogether. VMAT delivered lower mean doses to the oral cavity (7.8 vs. 9.0 Gy) and larynx (6.0 vs. 9.0 Gy), and no grade 2 mucositis or acute parotitis was observed (Table 3).

4.4.3. Adherence to Non-Invasive Ventilation

Telemetric monitoring of 73 patients at an Italian referral centre (CRESLA) examined adherence to home NIV, defined as at least four hours per night, at 1, 3, 6, and 12 months (Riva-Rovedda et al., 2026). Average use increased over time, yet roughly 30% of patients remained non-adherent at 6 and 12 months. A higher baseline ALSFRS-R respiratory subscore (OR = 0.78, p = 0.02) and having a male caregiver (OR = 0.19, p = 0.03) were associated with lower non-adherence. Percutaneous endoscopic gastrostomy (PEG) was independently associated with a more than three-fold higher risk of death or tracheostomy (HR = 3.42; 95% CI 1.54–7.59; p = 0.002), probably because it marks advanced, multisystem disease (Table 3).

4.4.4. Timing of Advance Care Planning

In a population-based cohort, advance care planning (ACP) tended to be finalised late (Moglia et al., 2023). The median time from symptom onset to ACP completion was 16.4 months (IQR 8.3–27.8), and the median interval from the start of non-invasive mechanical ventilation to ACP documentation was 5.42 months (IQR 1.4–12.8). These intervals argue for starting structured palliative conversations well before bulbar or respiratory decompensation (Table 3).

4.5. Neuroimaging, Cortical Organisation, and Epidemiological Risk

4.5.1. Choroid Plexus Enlargement and CSF Neuroinflammation

Using 3T structural MRI and an automated Bayesian Gaussian mixture model, Ma et al. (2026) measured choroid plexus (CP) volume in 161 patients newly diagnosed with sporadic ALS and 64 healthy controls. CP volume was larger in patients at every King's stage (p < 0.05, Bonferroni-corrected) and was largest at stage 3. In a longitudinal subgroup (n = 42), it increased significantly over time. In 38 patients with baseline CSF data, chitotriosidase-1 (CHIT1; β = 0.456, p < 0.001) and interleukin-6 (IL-6; β = 0.348, p = 0.01) independently predicted CP volume. Taken together, this suggests that CP enlargement reflects blood–CSF barrier disruption and progressive central neuroinflammation (Table 4).

4.5.2. Functional Connectivity Gradients and Cortical Hierarchy

Applying diffusion-map embedding to resting-state fMRI in 17 patients and 29 controls, Cai et al. (2026) found that the principal functional gradient, which runs from unimodal sensorimotor regions to transmodal association cortex, was compressed in ALS (p < 0.05, FDR-corrected). Gradient values rose in the sensorimotor (r = 0.506, p = 0.038) and visual (r = 0.534, p = 0.027) networks, and both correlated with disease duration. Values fell in the frontoparietal network (r = −0.792, p < 0.001) and the limbic network, and frontoparietal compression predicted functional impairment (r = 0.532, p = 0.028). Discriminant models built on network gradients reached AUCs of 0.712 to 0.866 (Table 4).

4.5.3. Compensatory Reorganisation of the Superior Parietal Lobule

Longitudinal resting-state fMRI in 14 patients at baseline (10 at a five-month follow-up) and 14 controls pointed to a compensatory reorganisation centred on the superior parietal lobule (SPL) (Ghaderi et al., 2026). At baseline, the right SPL was hyperconnected with visual hubs: the lateral visual network (β = 0.28, p-FDR = 0.032), the medial visual network (β = 0.36, p-FDR = 0.039), and the occipital fusiform gyrus (β = 0.31, p-FDR = 0.023). Over five months, as mean ALSFRS-R fell from 41.71 to 37.40, this hyperconnectivity grew. The SPL–fusiform connection rose to β = 0.41 (p-FDR = 0.006), lingual gyrus connectivity rose from β = 0.30 to 0.36, and occipital visual network connectivity reached β = 0.45 (p-FDR = 0.006). One interpretation, and the authors favour it, is that parietal cortex recruits visuospatial networks to preserve visuomotor function as corticospinal output fails (Table 4).

4.5.4. Midbrain Volumetric Pipelines and Head Injury as a Risk Factor

Mohammadi et al. (2026) compared a T1-weighted deep-learning pipeline (OpenMAP-T1) with a T2-weighted pipeline (pBrain) for the red nucleus (RN) and substantia nigra (SN) in 31 patients and 21 controls. Neither detected volume loss in ALS (p = 0.829), which may mean that microstructural change, such as iron accumulation, comes before measurable atrophy. The two pipelines disagreed sharply on ageing, however. pBrain-T2 detected age-related loss in the RN (p = 0.001) that OpenMAP-T1 missed (p = 0.116), whereas OpenMAP-T1 detected age-related loss in the SN (p = 0.026). The two sequences therefore seem to index different tissue properties and should not be treated as interchangeable (Table 4).

Finally, a meta-analysis of 17 studies with 578,815 participants found that prior traumatic head injury was associated with ALS (adjusted OR = 1.47; 95% CI 1.23–1.76; p < 0.001) (Toubasi & Al-Sayegh, 2026). The association was strong in men (OR = 2.27; 95% CI 1.41–3.66) but not significant in women (OR = 1.30; 95% CI 0.78–2.17). Single (OR = 1.48) and multiple (OR = 1.34) injuries both raised risk, but because there was no dose–response gradient, the authors suggest that head trauma acts more plausibly as a trigger or co-factor than as a direct cause (Table 4).

5. Between Computational Promise and Clinical Proof

5.1. Principal Findings

Two impressions stand out from this review, and they pull in somewhat different directions. The first is that computational repurposing for ALS has matured quickly. Within a short period, four quite different pipelines, built on motor cortex, spinal cord, whole blood, and single PBMCs, have produced mechanistically coherent candidates on at least four pathogenic axes (Figure 2; Table 2). The second is that almost none of these candidates has yet been tested in a way that would tell us whether it works. We do not think this is a failure of the individual studies, most of which are candid about their limits. It is better understood as a structural gap between what current computational methods can show and what a clinical trial needs to know (Figure 3).

5.2. What the Candidates Share, and Where They Diverge

It is worth pausing on how little the candidate lists overlap. Deferoxamine and disulfiram come from cortical tissue and a redox-and-metal story (deAndrés-Galiana et al., 2026). Clonidine and fingolimod come from blood and an immune-metabolic one (Sultan et al., 2026). Glibenclamide, tamoxifen, and quercetin come from a single circulating cell type (Pang et al., 2026), and memantine and the polyphenols from an RNA-processing hub (Eshak & Arumugam, 2025). One could read this lack of convergence as a sign that the methods are unreliable. We are inclined toward a gentler reading. ALS is heterogeneous in its genetics, its pathology, and its clinical course (Benatar et al., 2024; Hardiman et al., 2017). Different tissues sample different parts of that heterogeneity, so it would be more surprising if the candidates did converge. The practical implication, though, is uncomfortable. A drug nominated from blood should not be assumed to act on the motor cortex, and vice versa, unless there is independent evidence that it does (deAndrés-Galiana et al., 2026).

Some candidates rest on firmer ground than others. Iron chelation has at least preclinical support in SOD1G93A mice (Q. Wang et al., 2011), and systemic trace-element disturbance is now documented in patient serum (H. Wang et al., 2026). For memantine, pharmacological familiarity counts in its favour, and its hypothesised dual action on excitotoxicity and SMN1-dependent RNA stability is plausible, though still speculative (Eshak & Arumugam, 2025). Fingolimod and clonidine act on lymphocyte trafficking and peripheral immune tone, which the six-gene signature suggests are perturbed. But the same signature fails against mimics, so it may be flagging inflammation that is not specific to ALS (Sultan et al., 2026). The Mendelian randomization candidates occupy an interesting middle position. Genetic instruments reduce the risk that the target is merely reactive, which is a genuine advance (Pang et al., 2026). Still, a causal gene in a peripheral T-cell subset is not the same as a tractable drug target, and the drug-mapping step that follows is itself association-based.

5.3. The Specificity Problem

If we had to name a single finding that ought to change practice, it would be the collapse of discriminative performance when ALS is compared with its mimics (Figure 4). The six-gene transcriptomic signature fell from an AUC of 0.868 to 0.525 (Sultan et al., 2026), sTREM2 from 0.677 to 0.512, and even the four-marker fluid panel from 0.978 to 0.679 (Senerchia et al., 2026a). NfL held up best (0.821 against mimics), which is consistent with its role as a general but sensitive marker of axonal injury (Khalil et al., 2024; Senerchia et al., 2026a). The lesson for repurposing is fairly direct. If a disease signature cannot separate ALS from cervical myelopathy or multifocal motor neuropathy, then drugs that "reverse" that signature may be reversing the biology of motor-system injury in general. That might still be useful, but it is a different claim, and it should be tested as such.

This suggests that mimic cohorts should be treated as a required negative class in both biomarker and repurposing studies, not as an optional sensitivity analysis. The Miami Framework's separation of phenotype from biology offers a helpful conceptual scaffold here, since it encourages investigators to ask which biological axis a signature actually indexes (Benatar et al., 2024). The fluid-marker data point the same way. NfL, pTau181, and GFAP appear to report upper motor neuron injury, lower motor neuron denervation, and astroglial or age-related processes respectively (Senerchia et al., 2026b; Table 1). The detection of pTau181 in muscle raises the further possibility that part of the blood signal is peripheral in origin (Abu-Rumeileh et al., 2025). Stratifying future repurposing trials by these axes, rather than by clinical diagnosis alone, seems a reasonable next step. It would also help to use a harmonised assay platform (Mondesert et al., 2025).

5.4. From Signature Reversal to Pharmacology

A second concern is more technical but no less important. CMap reversal scores, WGCNA centrality, and DSigDB enrichment p values are measures of statistical association (deAndrés-Galiana et al., 2026; Sultan et al., 2026). They say nothing about whether a drug reaches the CNS at an adequate concentration, engages its target there, or does so safely over the months to years that ALS treatment requires. Because perturbation profiles come mostly from cancer cell lines under acute exposure, even the direction of the predicted effect may not hold in motor neurons or glia (deAndrés-Galiana et al., 2026). Several practical steps follow from this. Candidates could first be checked against known BBB permeability and CNS exposure data. Target engagement could then be tested in patient-derived iPSC motor neurons and glial co-cultures, followed by PK/PD modelling to identify plausible dose ranges. Whole-organism phenotypic screens, for which zebrafish are well suited, could bridge the gap to rodent models (Pushpakom et al., 2019; Sedighi et al., 2026; Williams & Hong, 2016). Peripheral readouts of central target engagement, such as ADEV pTDP-43, may eventually make it possible to see early in a trial whether a repurposed drug is doing what the model predicted (Butt et al., 2026).

The autophagy–exosome axis deserves a brief mention in this context. Impaired lysosomal clearance may divert aggregates into exosomes and spread pathology between cells, which makes this axis both a mechanistic target and a potential biomarker source (Sedighi et al., 2026). AI and knowledge-graph methods are well placed to integrate such multi-layer data (Xie et al., 2025), although, to our knowledge, they have not yet been applied to ALS with external validation of the kind we describe above.

5.5. Clinical, Imaging, and Epidemiological Context

It would be easy to treat the clinical and imaging literature as peripheral to repurposing. We think that would be a mistake. The HLSJ trial is a cautionary example of how analytical choices can shape conclusions. The prespecified LOCF analysis was null, whereas the post hoc MMRM analysis was positive, and the benefit concentrated in younger patients (Liu et al., 2026; Table 3). Future repurposing trials would do well to prespecify MMRM-type analyses and age or biomarker strata from the outset. The NIV data show that about 30% of patients remain non-adherent to a proven life-extending intervention (Riva-Rovedda et al., 2026). The ACP data show that decisions about ventilation are often made late (Moglia et al., 2023). Both are reminders that effective care depends on behaviour and timing as much as on pharmacology. The radiotherapy series offers a practical option for refractory sialorrhea, albeit from only six patients (Zhang et al., 2026).

Imaging adds a different kind of value. Choroid plexus enlargement, linked to CSF CHIT1 and IL-6, provides a structural marker of central neuroinflammation that could be used to monitor immunomodulatory candidates such as fingolimod (Ma et al., 2026; Table 4). Gradient compression and SPL hyperconnectivity suggest that the brain reorganises in response to motor decline. Treatment effects might therefore appear as preserved network architecture before they appear as clinical change (Cai et al., 2026; Ghaderi et al., 2026). The disagreement between T1- and T2-based midbrain pipelines, however, cautions against assuming that imaging end points are method-independent (Mohammadi et al., 2026). The head-injury meta-analysis, with its strong sex difference and lack of a dose–response gradient, reinforces the view of ALS as a multistep disease in which environmental exposures act on susceptible backgrounds (Toubasi & Al-Sayegh, 2026). This is, again, an argument for multi-target rather than single-target strategies.

5.6. Strengths and Limitations of This Study

This review has some strengths. It places computational predictions alongside biomarker, clinical, and imaging evidence rather than in isolation. It pays explicit attention to the direction of connectivity and to performance against mimics. And it grounds every quantitative statement in the source articles (Tables 1–4). It also has limitations that we should acknowledge. It is a narrative synthesis, so no pooled estimates were computed, and the appraisal of study quality was qualitative. Much of the evidence is very recent, drawn from single cohorts, and often not yet replicated. Some of the clinical and imaging studies have small samples (six patients in the sialorrhea series and 14 in the SPL study, for example). Finally, the computational literature is growing quickly enough that relevant studies may have appeared after our search closed.

5.7. Future Directions

Looking ahead, three developments would probably do the most good. The first is paired, tissue-matched datasets (CNS and blood from the same individuals, ideally at single-cell or single-nucleus resolution) that include mimic controls from the start. The second is perturbation atlases generated in human iPSC-derived motor neurons and glia under chronic exposure, which would make connectivity scores far more interpretable. The third is a shared, staged validation pipeline, moving from in silico prediction through mimic filtering, human cellular models, in vivo PK/PD work, and finally to biomarker-guided proof-of-concept trials (Figure 3). None of this is quick. But it seems a more reliable route than advancing each new computational shortlist directly into trials that were never designed to test it.

6. Conclusion

Computational drug repurposing has given ALS research something it has long lacked: a systematic way to generate therapeutic hypotheses from the disease's own molecular data. Consensus machine learning, co-expression networks, connectivity mapping, and single-cell Mendelian randomization have nominated plausible candidates across metal and redox stress, RNA metabolism, immune-metabolic signalling, and cytotoxic T-cell inflammation. Yet the evidence behind these candidates is, on closer inspection, thinner than the candidate lists might suggest. CNS and blood signatures diverge, discrimination against disease mimics is often close to chance, perturbation data rarely come from neural cells, and pharmacological validation is largely absent. The field therefore needs to shift its emphasis from generating more predictions to testing the ones it already has, using mimic-inclusive models, human cellular systems, quantitative PK/PD work, and biomarker-stratified trials. Only then, we suspect, will computational promise begin to translate into meaningful therapeutic benefit for people living with ALS and their families.

References


Abu-Rumeileh, S., Scholle, L., Mensch, A., Großkopf, H., Ratti, A., Kölsch, A., Stoltenburg-Didinger, G., Conrad, J., De Gobbi, A., Barba, L., Steinacker, P., Klafki, H.-W., Oeckl, P., Halbgebauer, S., Stapf, C., Posa, A., Kendzierski, T., Silani, V., Hausner, L., . . . Otto, M. (2025). Phosphorylated tau 181 and 217 are elevated in serum and muscle of patients with amyotrophic lateral sclerosis. Nature Communications, 16, Article 2019. https://doi.org/10.1038/s41467-025-57144-7

Ataei, R., Amini, J., Sanadgol, N., Simon, A. F., & Duennwald, M. L. (2026). Circular RNAs in amyotrophic lateral sclerosis. Neurobiology of Disease, 228, Article 107574. https://doi.org/10.1016/j.nbd.2026.107574

Benatar, M., Wuu, J., Huey, E. D., McMillan, C. T., Petersen, R. C., Postuma, R., McHutchison, C., Dratch, L., Arias, J. J., Crawley, A., Houlden, H., McDermott, M. P., Cai, X., Thakur, N., Boxer, A., Rosen, H., Boeve, B. F., Dacks, P., Cosentino, S., . . . Turner, M. R. (2024). The Miami Framework for ALS and related neurodegenerative disorders: An integrated view of phenotype and biology. Nature Reviews Neurology, 20(6), 364–376. https://doi.org/10.1038/s41582-024-00961-z

Butt, T. H., Strait, M., Marcinczyk, L., Katz, G., Kalia, V., Jaafar, C., Saxena, R., Divjan, A., Saglimbeni, B., Munoz Umanes, M. E., Tipps, E., Han, M., Mehta, P., Lee, I., Mitsumoto, H., Factor-Litvak, P., Shneider, N. A., Kioumourtzoglou, M.-A., & Re, D. B. (2026). Astrocyte-derived extracellular vesicle phosphorylated TDP-43 as a blood-based biomarker for amyotrophic lateral sclerosis. Neurobiology of Disease, 229, Article 107601. https://doi.org/10.1016/j.nbd.2026.107601

Cai, Z. W., Zhuang, S. P., Huang, Z. Y., Shi, J. Y., Huang, N. X., Chen, S., ... & Chen, H. J. (2026). Abnormal cortical hierarchy revealed by gradient dysfunction in patients with definite amyotrophic lateral sclerosis. Brain Research Bulletin, 111850.

deAndrés-Galiana, E. J., Fernández-Martínez, J. L., & Morís, G. (2026). Identifying candidate therapeutic targets in amyotrophic lateral sclerosis through a transcriptome-wide machine-learning consensus approach for drug repurposing. Neuroscience, 614, 163–179. https://doi.org/10.1016/j.neuroscience.2026.01.045

Eshak, D., & Arumugam, M. (2025). Integrative analysis of transcriptomics and drug-target networks identifies SMN1 as a novel biomarker and therapeutic target for amyotrophic lateral sclerosis. Journal of Genetic Engineering and Biotechnology, 23(4), Article 100615. https://doi.org/10.1016/j.jgeb.2025.100615

Feldman, E. L., Goutman, S. A., Petri, S., Mazzini, L., Savelieff, M. G., Shaw, P. J., & Sobue, G. (2022). Amyotrophic lateral sclerosis. The Lancet, 400(10360), 1363–1380. https://doi.org/10.1016/S0140-6736(22)01272-7

Ghaderi, S., Fatehi, F., Kalra, S., Mohammadi, S., Zemorshidi, F., Ramezani, M., Hesami, O., Pezeshgi, S., & Batouli, S. A. H. (2026). Functional adaptive longitudinal reorganization of superior parietal lobule networks in amyotrophic lateral sclerosis: Evidence suggesting compensatory mechanisms. Brain Research Bulletin, 240, Article 111900. https://doi.org/10.1016/j.brainresbull.2026.111900

Hardiman, O., Al-Chalabi, A., Chio, A., Corr, E. M., Logroscino, G., Robberecht, W., Shaw, P. J., Simmons, Z., & van den Berg, L. H. (2017). Amyotrophic lateral sclerosis. Nature Reviews Disease Primers, 3, Article 17071. https://doi.org/10.1038/nrdp.2017.71

Jia, Z., Liu, Y., Guan, N., Bo, X., Luo, Z., & Barnes, M. R. (2016). Cogena, a novel tool for co-expressed gene-set enrichment analysis, applied to drug repositioning and drug mode of action discovery. BMC Genomics, 17, Article 414. https://doi.org/10.1186/s12864-016-2753-2

Khalil, M., Teunissen, C. E., Otto, M., Piehl, F., Sormani, M. P., Gattringer, T., Barro, C., Kappos, L., & Kuhle, J. (2024). Neurofilaments as biomarkers in neurological disorders—Towards clinical application. Nature Reviews Neurology, 20(5), 269–287. https://doi.org/10.1038/s41582-024-00938-8

Li, L., & Kar, S. (2025). Applications of network pharmacology in drug discovery. Medicine in Drug Discovery, 27, Article 100220. https://doi.org/10.1016/j.medidd.2025.100220

Liu, X., Fu, W., Cui, X., Feng, Y., Wen, B., Shan, L., Xu, X., Yang, J., Zhang, J., He, L., Zang, Y., Zhao, S., Yao, X., Liu, Y., Ma, M., Du, B., Dang, J., Zou, Z., Feng, H., . . . Fan, D. (2026). Huoling Shengji granule in amyotrophic lateral sclerosis: A multicenter, randomized, double-blind, riluzole-controlled trial. Neurotherapeutics, 23(5), Article e00953. https://doi.org/10.1016/j.neurot.2026.e00953

Ma, M., Cui, B., Sun, X., Liu, S., Shao, K., Liu, F., Lin, P., Li, W., Zhao, Y., Yu, D., Lou, J., & Yun, Y. (2026). Progressive choroid plexus enlargement across disease stages in patients with sporadic amyotrophic lateral sclerosis. Neurobiology of Disease, 227, Article 107481. https://doi.org/10.1016/j.nbd.2026.107481

Masrori, P., & Van Damme, P. (2020). Amyotrophic lateral sclerosis: A clinical review. European Journal of Neurology, 27(10), 1918–1929. https://doi.org/10.1111/ene.14393

Miller, T. M., Cudkowicz, M. E., Genge, A., Shaw, P. J., Sobue, G., Bucelli, R. C., Chiò, A., Van Damme, P., Ludolph, A. C., Glass, J. D., Andrews, J. A., Babu, S., Benatar, M., McDermott, C. J., Lowe, T., Zhou, S., Tsiang, M., Fradette, S., Bennett, C. F., . . . VALOR and OLE Working Group. (2022). Trial of antisense oligonucleotide tofersen for SOD1 ALS. The New England Journal of Medicine, 387(12), 1099–1110. https://doi.org/10.1056/NEJMoa2204705

Moglia, C., Palumbo, F., Veronese, S., Vasta, R., Canosa, A., Manera, U., Torrieri, M. C., Grassano, M., Daviddi, M., & Chiò, A. (2023). Withdrawal of mechanical ventilation in amyotrophic lateral sclerosis patients: A multicenter Italian survey. Neurological Sciences, 44(12), 4349–4357. https://doi.org/10.1007/s10072-023-07011-0

Mohammadi, S., Ghaderi, S., Fatehi, F., & Batouli, S. A. H. (2026). Methodological divergence in sensitivity to age: Midbrain volumetric pipelines in amyotrophic lateral sclerosis. Brain Research Bulletin, 243, Article 112036. https://doi.org/10.1016/j.brainresbull.2026.112036

Mondesert, E., Delaby, C., De La Cruz, E., Kuhle, J., Benkert, P., Pradeilles, N., Duchiron, M., Morchikh, M., Camu, W., Cristol, J. P., Hirtz, C., Esselin, F., & Lehmann, S. (2025). Comparative performances of 4 serum NfL assays, pTau181, and GFAP in patients with amyotrophic lateral sclerosis. Neurology, 104(3), Article e213400. https://doi.org/10.1212/WNL.0000000000213400

Pang, X., Wang, H., Bai, J., & Huang, X. (2026). Integration of single-cell RNA sequencing and Mendelian randomization analysis for identifying potential immune therapeutic targets in amyotrophic lateral sclerosis. Biomedical and Environmental Sciences, 39(3), 327–341. https://doi.org/10.3967/bes2026.011

Pushpakom, S., Iorio, F., Eyers, P. A., Escott, K. J., Hopper, S., Wells, A., Doig, A., Guilliams, T., Latimer, J., McNamee, C., Norris, A., Sanseau, P., Cavalla, D., & Pirmohamed, M. (2019). Drug repurposing: Progress, challenges and recommendations. Nature Reviews Drug Discovery, 18(1), 41–58. https://doi.org/10.1038/nrd.2018.168

Riva-Rovedda, F., et al,. (2026). Time-dependent adherence to non-invasive ventilation in amyotrophic lateral sclerosis: An observational cohort study. Heart & Lung, 80, Article 102952. https://doi.org/10.1016/j.hrtlng.2026.102952

Scotter, E. L., Chen, H.-J., & Shaw, C. E. (2015). TDP-43 proteinopathy and ALS: Insights into disease mechanisms and therapeutic targets. Neurotherapeutics, 12(2), 352–363. https://doi.org/10.1007/s13311-015-0338-x

Sedighi, S., Guan, T., Michetti, F., Cordani, M., Behrooz, A. B., Sabouni, F., Eshraghi, M., Saleem, A., Ghavami, S., & Aghanoori, M.-R. (2026). Autophagy–exosome crosstalk in neurodegeneration: Mechanisms and therapeutic opportunities. Pharmacology & Therapeutics, 282, Article 109025. https://doi.org/10.1016/j.pharmthera.2026.109025

Senerchia, G., Iuzzolino, V. V., Spisto, M., Panico, F., Polito, C., Aruta, L., Fiorenza, M., Sirica, R., Terracciano, D., & Dubbioso, R. (2026a). Elevated plasma sTREM2 reflects microglial activation but lacks diagnostic and clinical relevance in amyotrophic lateral sclerosis. Neurobiology of Disease, 224, Article 107430. https://doi.org/10.1016/j.nbd.2026.107430

Senerchia, G., Iuzzolino, V. V., Spisto, M., Panico, F., Polito, C., Aruta, L., Fiorenza, M., Sirica, R., Terracciano, D., & Dubbioso, R. (2026b). Plasma NfL, GFAP and pTau181 define distinct biological axes in amyotrophic lateral sclerosis. Neurobiology of Disease, 224, Article 107415. https://doi.org/10.1016/j.nbd.2026.107415

Sultan, R., Liu, R.-J., Rafique, S., Li, L., Zheng, Z., Lv, H., Wang, X., & Wang, J. (2026). Integrative multi-phase transcriptomics for precision diagnostics and therapeutic target discovery in amyotrophic lateral sclerosis. Journal of Neurorestoratology, 14, Article 100313. https://doi.org/10.1016/j.jnrt.2026.100313

Toubasi, A. A., & Al-Sayegh, T. N. (2026). Head injuries as a risk factor for amyotrophic lateral sclerosis: A systematic review and meta-analysis. Clinical Neurology and Neurosurgery, 267, Article 109466. https://doi.org/10.1016/j.clineuro.2026.109466

Wang, H., Sun, Q., Du, R., Wang, S., Wang, Y., Bai, J., Li, M., & Huang, X. (2026). Serum trace elements and their associations with disease progression and survival in sporadic amyotrophic lateral sclerosis: Insights from a Chinese cohort. Biomedical and Environmental Sciences, 39(2), 183–191. https://doi.org/10.3967/bes2025.094

Wang, Q., Zhang, X., Chen, S., Zhang, X., Zhang, S., Youdim, M., & Le, W. (2011). Prevention of motor neuron degeneration by novel iron chelators in SOD1G93A transgenic mice of amyotrophic lateral sclerosis. Neurodegenerative Diseases, 8(5), 310–321. https://doi.org/10.1159/000323469

Williams, C. H., & Hong, C. C. (2016). Zebrafish small molecule screens: Taking the phenotypic plunge. Computational and Structural Biotechnology Journal, 14, 350–356. https://doi.org/10.1016/j.csbj.2016.09.001

Xie, T., Zhang, Z., Wang, Y., Wang, H., Chen, X., Han, F., & Shao, F. (2025). Artificial intelligence in drug development: From molecular discovery to precision medicine. Drug Discovery Today, 30(2), Article 104009. https://doi.org/10.1016/j.drudis.2025.104009

Zhang, E., Oh, P., Shamas, T., Patwa, H. S., & Johung, K. L. (2026). Radiation therapy for sialorrhea in patients with amyotrophic lateral sclerosis: A case series and critical review. Advances in Radiation Oncology, 11, Article 102135. https://doi.org/10.1016/j.adro.2026.102135


Article metrics
View details
0
Downloads
0
Citations
300
Views

View Dimensions


View Plumx


View Altmetric


0
Save
0
Citation
300
View
0
Share