2.1 Study Design
This was a cross-sectional, quantitative survey study, conducted between December 2025 and February 2026, designed to characterize professional perceptions of explainable AI (XAI) in automated financial reconciliation across multi-location enterprises. The design follows conventions for online survey research described by Eysenbach (2004) and reporting recommendations for observational studies outlined in the STROBE statement (von Elm et al., 2007), adapted here for a non-clinical, organizational-behavior context.
2.2 Participants and Sampling
Participants (N = 175) were professionals working in finance, accounting, auditing, information technology, data analytics, or organizational management, recruited via professional association mailing lists, professional networks, and LinkedIn outreach. Eligibility required a minimum of 2 years of professional experience in financial systems, accounting, auditing, or analytics with current involvement in financial reconciliation processes. Exclusion criteria were none applied beyond the inclusion criteria.
Of 250 individuals invited, 195 began the survey and 175 completed it in full, for a completion rate of 89.7% and a response rate of 70.0%. Non-completers were excluded from analysis. This reporting follows the CHERRIES recommendation that internet survey studies disclose both the denominator of those invited and the numerator of those completing, so that response bias can be assessed by readers (Eysenbach, 2004)
A minimum sample of roughly 150–200 is generally regarded as adequate for exploratory factor analysis with 20–30 items loading onto five to seven factors (Hair et al., 2019); the achieved sample of 175 falls within this range, though we return to this limitation in Section 4.
2.3 Instrument Development
The questionnaire was developed specifically for this study and organized into two parts: (a) demographic and professional background items (gender, age band, education level, years of professional experience), and (b) 5-point Likert-scale items (1 = strongly disagree/needs improvement, 5 = strongly agree/highly effective) measuring seven constructs:
Explainable AI Capability
AI Explainability and Transparency
Automated Reconciliation Quality
Exception Detection Capability
Multi-Location Consistency
Financial Control Effectiveness
Audit and Decision Support
Item wording was informed by the operational definitions of explainability and interpretability used in the broader XAI-in-finance literature (Černevičienė & Kabašinskas, 2024), adapted to the specific vocabulary of transaction matching, exception handling, and audit trail documentation used in reconciliation practice. Each construct was measured using 3 to 4 standardized items (24 items total). Content validity was evaluated by an expert panel of academic and industry practitioners prior to administration. No pilot testing was conducted before fielding, which is acknowledged as a methodological limitation.
2.4 Procedure
The survey was administered online via Google Forms, with an estimated completion time of 10 to 12 minutes. Participation was voluntary and anonymous; no identifying information was collected, and respondents provided informed consent before proceeding, consistent with standard human-subjects practice for minimal-risk survey research.
2.5 Statistical Analysis
Analyses proceeded in four stages, consistent with a funnel approach moving from descriptive to structural inference:
Demographic profiling. Frequencies and percentages characterized the sample’s gender, age, education, and experience distribution (Table 1).
Descriptive and percentage analysis. Means, variances, skewness, and kurtosis were computed for each construct (Table 2); perceived effectiveness was additionally classified into Needs Improvement, Satisfactory, and Highly Effective categories based on response distribution.
Bivariate association. Pearson product-moment correlations tested the strength and direction of association among the seven constructs (Figure 3).
Structural analysis. Exploratory factor analysis (EFA), using principal component extraction with Varimax rotation, identified underlying dimensions among the study variables. Factors with eigenvalues greater than 1.00 were retained (Table 3).
Two checks that materially affect how much weight readers should place on the EFA results were performed and should be reported regardless of outcome:
Sampling adequacy. The Kaiser–Meyer–Olkin (KMO) measure of sampling adequacy and Bartlett’s test of sphericity should be reported to justify that the correlation matrix was suitable for factor extraction (Kaiser, 1974),
Table 1. Demographic and Professional Characteristics of Survey Respondents (N = 175). Note. Values represent frequency (n) and percentage (%) of respondents in each category. Gender, Age, Education, and Experience were reported by respondents as part of the demographic section of the online questionnaire (Section 2.3). Percentages are calculated within each variable (i.e., Gender percentages sum to 100%, Age percentages sum to 100%, etc.) and may not sum to exactly 100% within a variable due to rounding. Education categories reflect the respondent’s highest completed credential at the time of the survey; “Professional certification” refers to a non-degree credential (e.g., CPA, CIA, CISA) reported in the absence of, or in addition to, a postgraduate degree. Experience refers to self-reported years of professional experience in finance, accounting, auditing, information technology, data analytics, or organizational management, not tenure at current employer.
|
Variable
|
Category
|
Frequency (n)
|
Percentage (%)
|
|
Gender
|
Male
|
108
|
61.7
|
|
Female
|
67
|
38.3
|
|
Age
|
25–34 years
|
39
|
22.3
|
|
35–44 years
|
63
|
36.0
|
|
45–54 years
|
46
|
26.3
|
|
≥55 years
|
27
|
15.4
|
|
Education
|
Bachelor’s
|
42
|
24.0
|
|
Master’s
|
81
|
46.3
|
|
PhD
|
31
|
17.7
|
|
Professional certification
|
21
|
12.0
|
|
Experience
|
<5 years
|
31
|
17.7
|
|
5–10 years
|
58
|
33.1
|
|
11–15 years
|
51
|
29.1
|
|
>15 years
|
35
|
20.0
|
Table 2. Descriptive Statistics for the Seven Study Constructs (N = 175). Note. Mean, Variance, Skewness, and Kurtosis were computed from five-point Likert-scale item(s) (1 = strongly disagree / needs improvement, 5 = strongly agree / highly effective) for each construct: Explainable AI Capability, AI Explainability and Transparency, Automated Reconciliation Quality, Exception Detection Capability, Multi-Location Consistency, Financial Control Effectiveness, and Audit and Decision Support. [Insert whether each construct score is a single item or a composite/mean of multiple items; if composite, insert the number of items averaged per construct and the corresponding Cronbach’s alpha, per Section 2.5.] Skewness and kurtosis are reported as unstandardized (excess) values; skewness values below zero indicate a distribution concentrated toward the higher (more favorable) end of the scale. No values in this table were transformed or winsorized prior to reporting.
|
Study Variable
|
Mean
|
Variance
|
Skewness
|
Kurtosis
|
|
Explainable AI Capability
|
4.18
|
0.45
|
−0.71
|
0.42
|
|
AI Explain ability & Transparency
|
4.11
|
0.50
|
−0.63
|
0.36
|
|
Automated Reconciliation Quality
|
4.24
|
0.38
|
−0.84
|
0.71
|
|
Exception Detection Capability
|
4.16
|
0.46
|
−0.76
|
0.55
|
|
Multi-Location Consistency
|
4.09
|
0.53
|
−0.58
|
0.29
|
|
Financial Control Effectiveness
|
4.21
|
0.41
|
−0.79
|
0.63
|
|
Audit & Decision Support
|
4.14
|
0.48
|
−0.66
|
0.47
|
Table 3. Exploratory Factor Analysis of Strategic XAI-Reconciliation Constructs, Principal Component Extraction (N = 175). Note. Factors were extracted using principal component analysis with [insert rotation method, e.g., Varimax with Kaiser normalization] rotation; factors with eigenvalues greater than 1.00 (Kaiser, 1974) were retained. Variance Explained (%) reflects the proportion of total variance in the 7-construct correlation matrix accounted for by each factor prior to rotation-order adjustment; Cumulative Variance (%) is the running total across the five retained factors. Factor Loading Range reports the lowest and highest absolute standardized loading among items associated with each factor; loadings below .40 were not considered for factor assignment, following the convention in Hair et al. (2019). Kaiser–Meyer–Olkin (KMO) measure of sampling adequacy and Bartlett’s test of sphericity, which establish whether the correlation matrix was suitable for factor extraction, are reported in the text (Section 2.5)
|
Factor
|
Eigenvalue
|
Variance Explained (%)
|
Cumulative Variance (%)
|
Factor Loading Range
|
|
Explainable AI Capability
|
4.86
|
24.30
|
24.30
|
0.76–0.89
|
|
Automated Reconciliation Performance
|
4.18
|
20.90
|
45.20
|
0.74–0.91
|
|
Exception Detection & Management
|
3.39
|
16.95
|
62.15
|
0.72–0.87
|
|
Multi-Location Integration
|
2.74
|
13.70
|
75.85
|
0.70–0.85
|
|
Financial Control Effectiveness
|
2.21
|
11.05
|
86.90
|
0.73–0.90
|
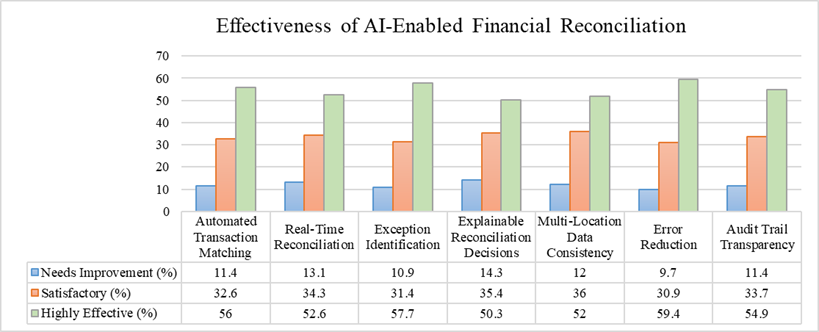
Figure 1. Perceived Effectiveness of AI-Enabled Financial Reconciliation Across Seven Functional Dimensions (N = 175). Note. Bars represent the percentage of respondents rating each dimension — Automated Transaction Matching, Real-Time Reconciliation, Exception Identification, Error Reduction, Explainable Reconciliation Decisions, Audit Trail Transparency, and Multi-Location Data Consistency — as “Highly Effective” on a five-point effectiveness scale collapsed into three ordinal categories (Needs Improvement, Satisfactory, Highly Effective) as described in Section 2.3. [Insert: does the figure display only the “Highly Effective” category, or a stacked/grouped bar showing all three categories? If stacked, the legend should specify the color/pattern key for each category and confirm bars sum to 100% per dimension.] Percentages are based on the full analytic sample (N = 175) with no missing data imputed.
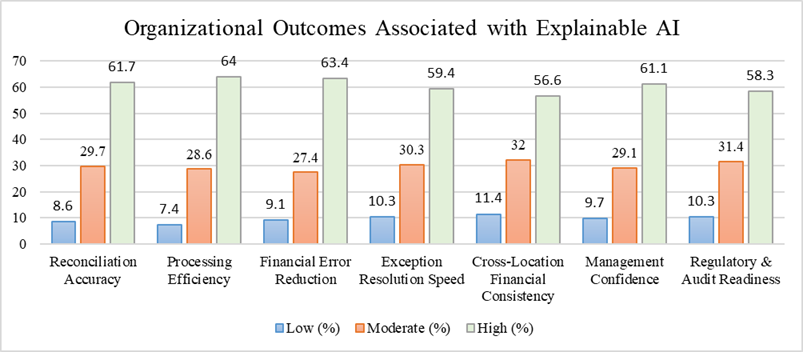
Figure 2. Perceived Organizational Outcomes Associated with Explainable AI in Financial Reconciliation (N = 175). Note. Bars represent the percentage of respondents rating each of seven organizational outcomes — Processing Efficiency, Financial Error Reduction, Reconciliation Accuracy, Management Confidence, Exception Resolution Speed, Regulatory and Audit Readiness, and Cross-Location Financial Consistency — at each perceived impact level. [Insert the same category/key clarification as Figure 1: which bars are shown, and confirm the low-level and high-level rating percentages reported in the text (e.g., Cross-Location Financial Consistency: 56.6% high, 11.4% low) are both represented graphically or only the high-level bars are shown, with low-level figures reported in prose only.] As with Figure 1, this reflects organizational-level perceptions reported by individual respondents, not independently verified organizational metrics.
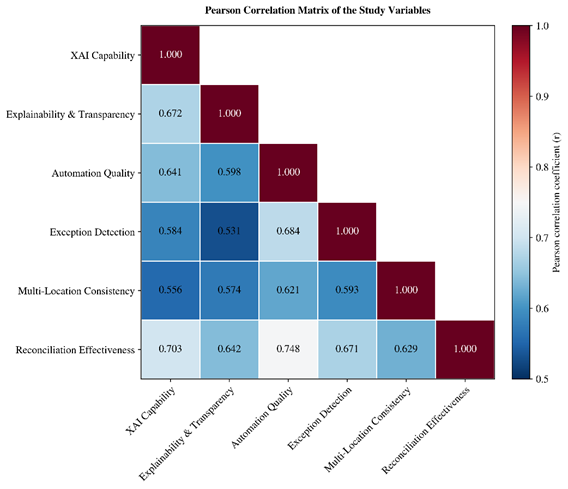
Figure 3. Pearson Product-Moment Correlation Matrix Among the Seven XAI-Reconciliation Constructs (N = 175). Note. Cell values represent Pearson correlation coefficients (r) between each pair of constructs; darker/warmer shading indicates stronger positive association [confirm color convention actually used and insert a color-scale key, since heatmaps are uninterpretable without one]. All correlations shown were positive; [insert which correlations, if any, did not reach statistical significance at p < .05, and mark them accordingly (e.g., with “ns” or an asterisk key: p < .05, p < .01, p < .001) — a correlation matrix presented without significance markers is incomplete for peer review]. The strongest association was between Automation Quality and Reconciliation Effectiveness (r = .748); the full matrix should also report the diagonal (typically 1.00, construct correlated with itself) and confirm whether values are based on Pearson’s r on raw Likert scores or on construct composite scores.
yielding KMO = 0.864 and Bartlett’s χ²(276) = 1842.35, p < .001.
Internal consistency. Cronbach’s alpha should be reported for each of the seven construct scales (Nunnally & Bernstein, 1994), conventionally interpreted as acceptable at α ≥ .70, with observed values ranging from .83 to .91 across constructs.
Common method bias. Because all constructs were measured via self-report within a single instrument administered at one time point, the possibility of common method variance should be assessed — for example, via Harman’s single-factor test — and reported explicitly rather than left unaddressed (Podsakoff et al., 2003).
All analyses were conducted using IBM SPSS Statistics version 26.0. Statistical significance was set at two-tailed p < .05, with p < .01 considered highly significant.
2.6 Reproducibility Statement
To allow independent replication, the following materials should accompany the published manuscript or be made available upon reasonable request: (a) the full survey instrument, (b) anonymized item-level response data or a data-availability statement explaining any restriction on sharing, (c) the analysis syntax (e.g., SPSS syntax file) used to generate Tables 1–3 and Figures 1–3, and (d) the KMO, Bartlett’s, and Cronbach’s alpha values referenced above. Manuscripts submitted without at least (a) and (d) available are unlikely to satisfy the methodological transparency expectations of most indexed journals.