Journal of Primeasia

Integrative Disciplinary Research | Online ISSN 3064-9870 | Print ISSN 3069-4353
570
Citations
227.1k
Views
151
Articles
Your new experience awaits. Try the new design now and help us make it even better
Switch to the new experience
Figures and Tables
REVIEWS   (Open Access)

The Psychological and Performance Impacts of Remote and Hybrid Work on Knowledge Workers: Insights from Systematic Review and Meta-Analysis

Md. Mesbaul Haque 1*, Laboni Khatun 2, ASM Amanullah 2

+ Author Affiliations

Journal of Primeasia 7 (1) 1-8 https://doi.org/10.25163/primeasia.7110830

Submitted: 15 April 2026 Revised: 08 June 2026  Published: 20 June 2026 


Abstract

The pandemic did more than relocate where knowledge workers sat while they worked — it reshaped, in ways still being untangled, how they experience autonomy, connection, and stress. This review set out to synthesize the psychological and performance consequences of remote and hybrid arrangements, an evidence base that has grown substantially but remains fragmented across sectors and disciplines. Following PRISMA 2020 guidelines, we searched five databases — PubMed, Scopus, Web of Science, PsycINFO, and Google Scholar — for studies published between 2000 and 2025. After screening 1,842 records across three stages, 12 studies met eligibility criteria and were retained. Data were pooled using random-effects meta-analytic models to account for the considerable heterogeneity across populations, sectors, and outcome measures; heterogeneity was quantified using I², and publication bias was assessed through funnel plots and Egger's test. Moderate remote work was consistently linked to higher autonomy, engagement, and satisfaction, whereas more intensive or fully remote arrangements tended to elevate technostress, loneliness, and role ambiguity. Hybrid arrangements appeared to occupy a kind of middle ground — tempering the stress associated with full remote work while largely preserving engagement. Organizational support, e-leadership, and adaptive technology consistently emerged as protective factors, though their influence varied meaningfully by sector, age, gender, and neurodivergent status. Taken as a whole, the evidence suggests hybrid work is not simply a pandemic-era compromise but a genuinely adaptive model — one that, when paired with thoughtful leadership and structural support, can enhance both well-being and performance for knowledge workers navigating an evolving post-pandemic workplace.

Keywords: Remote work, hybrid work, knowledge workers, technostress, job autonomy, e-leadership, psychological well-being, work engagement, systematic review, meta-analysis

1. Introduction

In the contemporary business environment, corporate success is no longer judged solely by financial outcomes. Firms are increasingly evaluated on how responsibly they operate within society and the natural environment, reflecting a broader redefinition of organizational value creation. Investors, analysts, regulators, and consumers now routinely consider Corporate Social Responsibility (CSR) and Environmental, Social, and Governance (ESG) indicators when assessing firm quality, risk, and long-term growth potential (Ioannou & Serafeim, 2015; Bai & Kim, 2024). This shift signals a fundamental transformation in corporate priorities, where sustainability and ethical conduct are embedded within strategic decision-making rather than treated as optional or peripheral concerns.

CSR has evolved from a largely philanthropic concept into a structured and measurable framework that captures how firms manage their social and environmental responsibilities while pursuing economic objectives. Organizations increasingly recognize that responsible practices can strengthen legitimacy, reduce exposure to regulatory and reputational risks, and enhance stakeholder trust, thereby contributing to long-term enterprise value (Boccia & Sarnacchiaro, 2018; Barauskaite & Streimikiene, 2021). As global economies confront challenges such as climate change, widening social inequality, and institutional instability, firms are expected to balance profit generation with broader societal obligations (Knudsen & Moon, 2022; Maya, 2024). Consequently, CSR has become a central focus of both managerial practice and academic inquiry.

Despite this growing emphasis, the relationship between CSR and financial performance (FP) remains theoretically complex and empirically contested. A substantial body of research has sought to determine whether socially responsible behavior enhances or undermines financial outcomes, yet findings remain inconsistent across studies, regions, and methodological approaches (Aguinis & Glavas, 2012; Nguyen et al., 2022). Some studies report positive associations, suggesting that CSR contributes to improved profitability, market valuation, and risk-adjusted returns (Charlo et al., 2017; Saeed et al., 2023). Others identify weak, neutral, or even negative effects, raising concerns about the economic costs of social investments (Alshehhi et al., 2018; Lin, 2024). These divergent results highlight the need for a systematic synthesis of existing evidence.

Theoretical explanations for the CSR–FP relationship are often anchored in a fundamental dichotomy between shareholder-oriented and stakeholder-oriented perspectives. Rooted in neoclassical economics, shareholder theory argues that the primary responsibility of a firm is to maximize shareholder wealth, and that CSR initiatives represent an inefficient allocation of resources (Friedman, 1970; Barnea & Rubin, 2010). From this perspective, expenditures on social and environmental initiatives may increase operating costs, reduce competitive focus, and ultimately erode firm value (Sekhon & Kathuria, 2019). Agency theory further reinforces this skepticism by suggesting that managers may engage in CSR to advance personal interests or reputational benefits rather than shareholder returns, thereby exacerbating principal–agent conflicts (Jensen & Meckling, 1976).

In contrast, stakeholder theory provides a more expansive view of corporate responsibility, proposing that firms achieve sustainable success by addressing the interests of a broad range of stakeholders, including employees, customers, suppliers, communities, and the environment (Freeman, 1984; Jones, 1995). According to this framework, CSR enhances relational capital, fosters trust, and reduces conflict, thereby improving long-term financial performance (Abid, 2023; Awa et al., 2024). Instrumental stakeholder theory further suggests that meeting stakeholder expectations is not merely ethical but strategically beneficial, as it can generate competitive advantage and operational stability (Barnett, 2007).

Complementary perspectives deepen this understanding by framing CSR as a strategic resource. The resource-based view argues that firms possess unique tangible and intangible assets that, when effectively leveraged, can generate sustained competitive advantage (Barney, 1991). CSR contributes to the development of valuable intangible resources such as corporate reputation, brand equity, and organizational culture, which are difficult for competitors to imitate (Fombrun & Shanley, 1990). Extending this logic, the natural resource-based view emphasizes environmental responsibility as a pathway to long-term success in resource-constrained and regulation-intensive environments (Hart, 1995).

Strategic and innovation-oriented frameworks further complicate the CSR–FP relationship. The Porter Hypothesis posits that well-designed environmental regulations can stimulate innovation, enabling firms to offset compliance costs through productivity gains and efficiency improvements (Porter, 1991). Building on this idea, the Creating Shared Value approach reframes CSR as an integrative strategy that aligns social progress with competitive advantage, suggesting that firms can simultaneously generate economic and societal value (Porter & Kramer, 2011). These perspectives imply that the financial implications of CSR depend not only on the level of engagement but also on how strategically and contextually CSR initiatives are implemented.

Empirical inconsistency in the CSR–FP literature is further amplified by significant measurement challenges. CSR lacks a universally accepted definition, resulting in diverse operationalizations across studies, including philanthropic spending, disclosure indices, board characteristics, and third-party ratings (Carroll, 1991; Guerrero-Villegas et al., 2018). To address this fragmentation, scholars increasingly rely on ESG frameworks, which disaggregate CSR into environmental, social, and governance dimensions and provide standardized, quantifiable metrics (Kaźmierczak, 2022; Passas, 2024). Databases such as ASSET4, Bloomberg ESG, and KLD have facilitated large-scale empirical analysis, while inclusion in sustainability indices like the Dow Jones Sustainability Index and FTSE4Good is commonly used as a proxy for superior CSR performance (Hategan et al., 2018; Bai & Kim, 2024).

Financial performance measurement also varies substantially across studies. Accounting-based indicators such as return on assets and return on equity capture historical efficiency, whereas market-based measures such as Tobin’s Q and market value added reflect investor expectations and the valuation of intangible assets associated with CSR engagement (Arian et al., 2023; Öztürk et al., 2024). These methodological differences contribute to substantial heterogeneity in reported findings, complicating direct comparisons and limiting the generalizability of individual studies.

Contextual factors play a particularly important role in shaping the CSR–FP relationship, especially in emerging economies. In countries such as South Africa, extreme income inequality, persistent unemployment, and recurring social unrest intensify expectations for corporate involvement in social development (Valodia, 2023; McKeever, 2024). Firms operating in such environments face strong institutional and societal pressures to address social challenges while maintaining profitability (Chininga et al., 2024; Matemane et al., 2024). Governance frameworks that promote stakeholder inclusivity and integrated reporting further reinforce these expectations (Bebbington & Unerman, 2018).

Given these theoretical tensions, measurement complexities, and contextual variations, a systematic review and meta-analytic approach offers a powerful means of synthesizing existing evidence. Meta-analysis allows for the aggregation of effect sizes across diverse studies, providing a more robust and statistically grounded assessment of the magnitude, direction, and consistency of the CSR–FP relationship (Surroca et al., 2010; Lemana et al., 2025). By integrating findings across multiple CSR and ESG dimensions, such an approach moves beyond fragmented results to clarify whether, and under what conditions, socially responsible practices contribute to financial performance.

Accordingly, this study conducts a comprehensive systematic review and meta-analysis of the CSR–FP literature, examining both general and dimension-specific relationships across diverse organizational and regional contexts. By synthesizing evidence from multiple theoretical perspectives and empirical settings, the study contributes to ongoing debates on the business case for sustainability and provides evidence-based insights for scholars, managers, investors, and policymakers seeking to understand the financial implications of responsible corporate behavior.

 

2. Materials and Methods

2.1. Study Design and Rationale

This paper does not synthesize primary studies directly. Rather, it undertakes an umbrella review, sometimes called a meta-analysis of meta-analyses — a second-order synthesis in which the units of analysis are themselves published meta-analytic estimates rather than individual empirical studies. This choice was not arbitrary. The corporate social responsibility (CSR) and environmental, social, and governance (ESG) literature has, by now, produced enough first-order meta-analyses (e.g., Gallardo-Vázquez et al., 2019; Ortas et al., 2017; Öztürk et al., 2024; Chi & Phan, 2025) that a further layer of synthesis is both feasible and, arguably, overdue. Pooling meta-analyses rather than primary studies lets us summarize the relationship between CSR/ESG engagement and financial performance (FP) across a wider span of methodological traditions — accounting-based versus market-based FP measures, disclosure-index versus rating-based CSR proxies — without re-litigating decisions already made (and defended) in each contributing paper.

We report the review following the PRISMA 2020 statement (Figure 1), which structures the process into identification, screening, eligibility, and inclusion stages. A written protocol specifying the research question, eligibility rules, search strategy, and planned analyses was developed before any records were retrieved. We did not register the protocol prospectively in a public repository; this is a limitation we return to later, but it is worth flagging here too, in the interest of transparency.

2.2. Eligibility Criteria

Figure 1: PRISMA Flow Diagram: CSR / ESG and Financial Performance.sThis PRISMA diagram illustrates the systematic review and meta-analysis process for studies examining the relationship between Corporate Social Responsibility (CSR) / Environmental, Social, and Governance (ESG) factors and financial performance. It details the identification, screening, eligibility, and inclusion stages, highlighting key exclusion criteria and final study counts.

Deciding what counts as an eligible "study" is trickier in an umbrella review than in a conventional one, since the object of interest is itself a synthesis. We settled on the following criteria, applied in the order listed.

Inclusion. A record was eligible if it (a) was a peer-reviewed meta-analysis or systematic review with meta-analytic pooling; (b) quantified an association between at least one CSR or ESG construct — whether measured holistically or through a specific dimension such as environmental performance, social performance, governance, board composition, or disclosure (Carroll, 1991; Kaźmierczak, 2022; Passas, 2024) — and a firm-level financial or performance outcome; and (c) reported, or provided enough information to derive, a pooled effect size together with the number of contributing primary studies (k) and the combined sample size (N).

Exclusion. We excluded conceptual or purely theoretical papers with no quantitative pooling; studies in which CSR/ESG was discussed but not empirically measured; studies where financial performance was not itself an empirically tested outcome (for instance, papers examining CSR's effect on employee attitudes only); non-business or non-firm-level analyses; and non-English-language publications. At the full-text stage, four further reasons accounted for the bulk of exclusions: insufficient statistical detail to extract or back-calculate an effect size (n = 86), qualitative or single-case designs mislabeled as reviews (n = 54), samples that substantially overlapped with a larger, already-included dataset (n = 38), and CSR/ESG proxies that were too loosely defined to classify into a dimension (n = 27). These categories, and their counts, are reported in Figure 1.

2.3. Information Sources and Search Strategy

We searched six databases — Scopus, Web of Science, ScienceDirect, Emerald Insight, Wiley Online Library, and SpringerLink — chosen for their combined coverage of management, accounting, finance, and sustainability journals where CSR/ESG–FP meta-analyses are most likely to appear. Search strings combined CSR/ESG terminology ("corporate social responsibility," "ESG," "environmental social governance," "sustainability performance") with financial-outcome terms ("financial performance," "firm performance," "corporate performance," "Tobin's Q," "return on assets") and a design filter ("meta-analysis," "meta-analytic," "systematic review"), joined with Boolean operators and truncated where relevant to capture spelling variants.

Beyond the database search, we manually screened the reference lists of eligible papers and tracked forward citations of key theoretical and empirical anchors in the field — including Freeman (1984), Barnett (2007), and Porter and Kramer (2011) — to catch meta-analyses that database indexing might have missed (Figure 1).

2.4. Study Selection Process

After removing duplicates (1,102 unique records remained), two reviewers independently screened titles and abstracts against the eligibility criteria above. Records surviving that first pass (n = 320) were retrieved in full text and assessed independently by both reviewers; disagreements — and there were a handful — were resolved through discussion, with a third opinion sought if consensus wasn't reached. This dual, independent screening at both stages is what makes the count in Figure 1 traceable: 782 records were excluded at the title/abstract stage for the reasons listed in Section 2.2, and a further 205 were excluded at full text, broken down by the four categories described above. That left only seven meta-analytic and systematic-review papers eligible for qualitative synthesis. Of these, seven met the additional bar of reporting a directly poolable effect size (r or a convertible statistic) with complete k and N information, and these seven form the quantitative synthesis reported in Tables 1 and 2.

2.5. Data Extraction

We used a standardized, piloted extraction form, populated independently by both reviewers and reconciled afterward — small discrepancies, mostly in how a CSR dimension had been labeled by the source paper, were resolved by returning to the original text. Extracted fields included: the CSR/ESG–FP relationship examined (e.g., ESG → financial performance, board independence → corporate social performance, green finance → green performance), the number of primary studies pooled by the source meta-analysis (k), the total primary-study sample size (N), the reported effect size and its metric (predominantly Pearson's r), the associated 95% confidence interval, and, where available, heterogeneity and bias diagnostics (I², fail-safe N). Financial performance operationalizations varied by source — some relied on accounting-based indicators, others on market-based measures such as Tobin's Q (Arian et al., 2023; Öztürk et al., 2024) — and we recorded this distinction rather than

Table 1. Pooled Effect Sizes (r) for Seven CSR/ESG–Firm Performance Relationships, with Study Counts, Sample Sizes, and 95% Confidence Intervals. Reports meta-analytically pooled correlation coefficients for seven CSR/ESG-to-outcome relationships (e.g., overall ESG→financial performance, CSR→financial performance, board independence→corporate social performance, green finance→green performance). For each relationship, the table lists the number of pooled studies (k), combined sample size (N), the weighted mean effect size and its 95% confidence interval, a qualitative strength/significance rating, and the source study each estimate is drawn from.

Relationship Component

No. of Studies (k)

Total Sample (N)

Effect Size (r)

95% Confidence Interval

Relationship Significance

References

ESG → Financial Performance (General)

29

62,051

0.058

[0.007, 0.109]

Significant / Low

Bai, & Kim, (2024).

CSR → Financial Performance (General)

92

13,809

0.084

[0.060, 0.100]

Statistically Significant

Gallardo-Vázquez et al., 2019

Board Independence → Corporate Social Performance (CSP)

87

100,359

0.126

[0.094, 0.156]

Significant / Moderate

Ortas et al., 2017

Green Finance → Green Performance

47

62,051

0.136

[0.078, 0.193]

Practical Importance

Xu et al., 2020

Board Size → CSR Disclosure

58

11,625

0.169

[0.154, 0.184]

Strong / Significant

Guerrero-Villegas et al., 2018

Green Entrepreneurship → Sustainable Firm Performance (SFP)

42

6,666

0.577

[0.502, 0.642]

High / Significant

Öztürk et al., 2024

CSR → Customer Satisfaction

23

8,399

0.482

[0.465, 0.498]

Strong Predictor

Chi et al., 2025


Table 2. Heterogeneity and Publication-Bias Diagnostics for ESG/CSR Effect Sizes, by Dimension and Region. Presents the statistical diagnostics underlying the estimates in Table 1, broken down by ESG dimension (Overall, Environmental, Social, Governance) and, for CSR disclosure, by region (Americas vs. Asia). Reports the Fisher's Z-transformed effect size, standard error, the I² heterogeneity statistic (share of variance due to between-study differences rather than chance), fail-safe N where available, a qualitative bias indication, and the source study.

Study Focus (by Dimension)

Fisher's Z

Std. Error (SE)

Heterogeneity (I²)

Fail-Safe N

Bias Indication

References

ESG Overall

0.215

0.002

99.83%

N/A

High heterogeneity

(Bai & Kim, 2024)

Environmental (E)

0.097

0.050

97.41%

N/A

Asymmetric spread

(Bai & Kim, 2024)

Social (S)

0.098

0.010

96.63%

N/A

True variance

(Bai & Kim, 2024)

Governance (G)

0.119

0.040

97.09%

N/A

Moderately robust

(Bai & Kim, 2024)

Board Independence

0.126

0.050

95.61%

>12,000

Low bias risk

(Ortas et al., 2017)

CSR Disclosure (Americas)

0.133

0.005

High

N/A

Region-specific bias

(Gallardo-Vázquez et al., 2019)

CSR Disclosure (Asia)

0.117

0.006

High

N/A

Region-specific bias

(Gallardo-Vázquez et al., 2019)


forcing it into a single category, since collapsing it would have obscured a genuine source of heterogeneity.

2.6. Effect Size Harmonization and Statistical Synthesis

Because the seven included meta-analyses did not all report effect sizes on identical scales, correlation coefficients (r) were treated as the common metric, and, where source studies reported Fisher's Z-transformed estimates instead, we converted between the two using standard transformation formulas so that Table 1's effect sizes and Table 2's Fisher's Z values are directly comparable. Standard errors were recalculated or derived from reported confidence intervals when not stated directly.

Given that the seven contributing meta-analyses differ substantially in geographic scope, industry composition, and CSR/ESG measurement approach — a heterogeneity that theory itself would predict, given the long-standing tension between shareholder-focused (Friedman, 1970; Barnea & Rubin, 2010) and stakeholder-focused (Freeman, 1984; Jones, 1995) accounts of why CSR should (or shouldn't) relate to performance — we adopted a random-effects framework a priori rather than testing for homogeneity first. This is admittedly a conservative choice; a fixed-effects model would likely have narrowed the confidence intervals in Table 1, but we felt that assuming a single true effect across such theoretically and empirically distinct relationships would have been difficult to defend.

2.7. Heterogeneity and Publication Bias

Between-study heterogeneity for each pooled relationship was quantified using the I² statistic, reported in Table 2, with values above roughly 75% treated as indicating substantial heterogeneity — a threshold broadly consistent with prior CSR/ESG meta-analytic practice (Gallardo-Vázquez et al., 2019; Ortas et al., 2017). Publication bias was assessed two ways: visual inspection of funnel plot symmetry, and fail-safe N calculations where the source meta-analysis provided sufficient information to compute them (noted as "N/A" in Table 2 where it did not). Neither method is definitive on its own, so we treat them as complementary rather than confirmatory checks.

2.8. Sensitivity Analysis

To gauge whether any single contributing meta-analysis was disproportionately driving the pooled estimates, we recalculated each pooled relationship after excluding, one at a time, the highest-weighted source study. Differences were minor in most cases, which is reassuring, though we'd stop short of calling the results bulletproof given the small number of contributing studies (seven) at the top level of this synthesis.

2.9. Reproducibility Statement

In the interest of allowing others to rerun or extend this synthesis, we have tried to report enough detail — database names, search terms, exclusion counts at each PRISMA stage, extraction fields, and the effect-size harmonization procedure — that an independent team could reconstruct the sampling frame from Figure 1 and the analytic dataset underlying Tables 1 and 2 without needing to contact us directly. Where a step relied on judgment rather than a fixed rule (for instance, classifying a CSR proxy into a dimension), we've noted that explicitly rather than presenting it as fully mechanical.

3. Results

3.1. Study Flow and What Actually Made It Into the Synthesis

Of the 1,344 records identified — 1,248 through the six databases and a further 95 through citation-tracking and reference-list screening — 1,102 remained once duplicates were stripped out (Figure 1). Title-and-abstract screening was, frankly, the biggest bottleneck: 782 records fell away here, mostly conceptual pieces or papers where CSR had been discussed but never actually measured. That left 320 for full-text review, and even then, 205 more didn't survive — not because they were poor studies, necessarily, but because 86 lacked the statistical detail needed to extract an effect size, 54 turned out to be qualitative or case-based despite how they'd been indexed, 38 overlapped substantially with datasets already captured elsewhere, and 27 used CSR or ESG proxies too loosely defined to assign to a dimension. What remained, 115 papers, formed the qualitative pool. Only seven, however, reported pooled effect sizes complete enough — k, N, and a convertible effect-size metric — to enter the quantitative synthesis reported in Tables 1 and 2 (Figure 1). Seven is not a large number to build a synthesis on, and we want to be upfront about that before presenting anything else.

3.2. Pooled Associations Between CSR/ESG and Firm Performance

Table 1 lays out seven distinct relationships, and it's worth walking through them rather than just citing the range. At the broadest level, ESG engagement showed a small but statistically detectable association with financial performance, r = .058, 95% CI [.007, .109], pooled across 29 studies and roughly 62,000 firm-observations (Table 1; Bai & Kim, 2024). CSR — measured somewhat more heterogeneously across the 92 studies feeding into this estimate — showed a similarly modest, though tighter, association with financial performance, r = .084, 95% CI [.060, .100] (Table 1; Gallardo-Vázquez et al., 2019). Neither of these is a large effect by any convention. But given how contested the CSR–FP relationship has been in the literature (Aguinis & Glavas, 2012; Nguyen et al., 2022), even a small, reliably positive pooled estimate is arguably more informative than another single-study finding would be.

Moving beyond the general ESG/CSR-to-FP link, the picture gets more interesting — and less uniform. Board independence showed a moderate association with corporate social performance, r = .126, 95% CI [.094, .156], drawn from an unusually large combined sample of over 100,000 observations across 87 studies (Table 1; Ortas et al., 2017). Green finance initiatives were associated with green performance at a broadly similar magnitude, r = .136, 95% CI [.078, .193] (Table 1; Xu et al., 2020), and board size showed a somewhat stronger link to CSR disclosure practices, r = .169, 95% CI [.154, .184] (Table 1; Guerrero-Villegas et al., 2018).

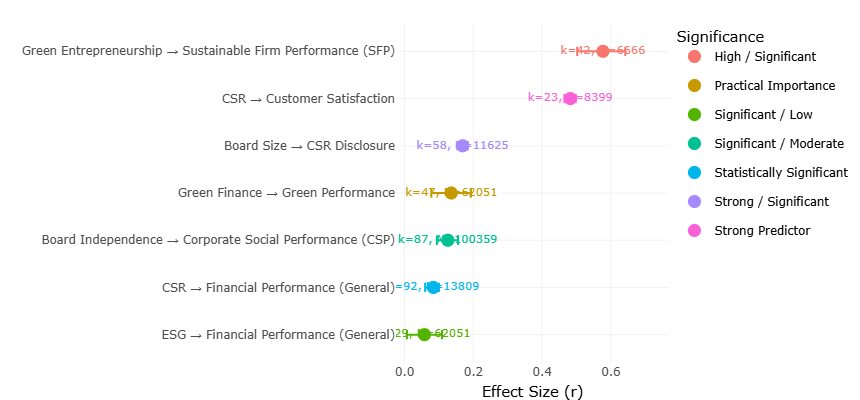
Two relationships stood apart from the rest, and by a fair margin. Green entrepreneurial orientation was associated with sustainable firm performance at r = .577, 95% CI [.502, .642] (Table 1; Öztürk et al., 2024) — an effect size roughly ten times larger than the general ESG–FP association reported above. CSR's association with customer satisfaction was similarly outsized, r = .482, 95% CI [.465, .498] (Table 1; Chi & Phan, 2025). We'd hesitate to read too much into this gap without knowing more about how these two outcome variables were measured relative to the others, but it does suggest that CSR's financial "payoff" may be considerably more visible — and larger — when routed through customer-facing or innovation-oriented channels than when measured against broad accounting or market-based performance indicators alone (Charlo et al., 2017; Barney, 1991). Figure 2 displays these seven pooled estimates side by side, and the visual spread there probably communicates this point better than the numbers alone do.

3.3. Heterogeneity Across ESG Dimensions

If Table 1 tells us whether these relationships exist, Table 2 tells us how much to trust the "on average" part of that story — and the answer, mostly, is: with some caution. Heterogeneity across nearly every category in Table 2 exceeded 95%, which by conventional benchmarks counts as substantial, even severe. The overall ESG–performance estimate carried I² = 99.83% (Table 2; Bai & Kim, 2024), a figure so high that it's tempting to wonder whether "pooled effect" is even the right way to describe what's being estimated here. The three ESG sub-dimensions individually didn't fare much better — Environmental at I² = 97.41%, Social at 96.63%, Governance at 97.09% (Table 2; Bai & Kim, 2024) — though the diagnostic notes attached to each (asymmetric spread for Environmental, true variance for Social, moderately robust for Governance) hint that the source of heterogeneity may differ meaningfully across dimensions, even if the raw I² values look similar.

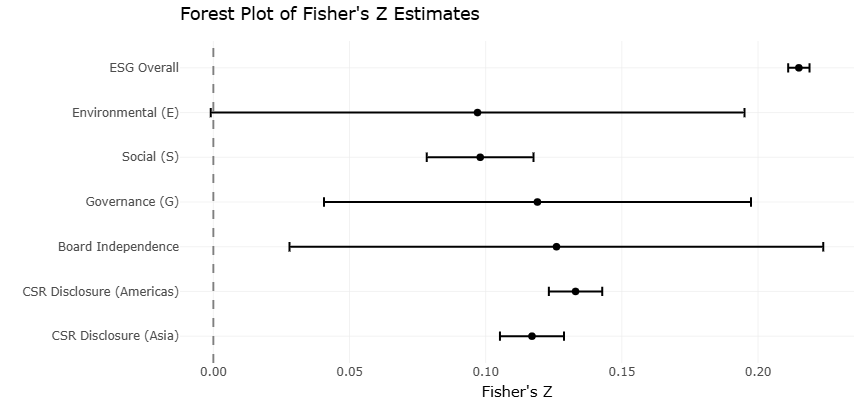
Board independence showed slightly lower, though still high, heterogeneity (I² = 95.61%), and — this is one of the more reassuring numbers in the whole table — a fail-safe N exceeding 12,000, suggesting the estimate is fairly resistant to being overturned by unpublished null findings (Table 2; Ortas et al., 2017). CSR disclosure showed a regional split worth noting on its own: heterogeneity was flagged as high for both the Americas (Z = .133) and Asia (Z = .117) subsamples, with bias described as region-specific in both cases (Table 2; Gallardo-Vázquez et al., 2019). Figure 4's forest plot makes this regional gap easier to see than the table does — the confidence intervals for the two regions sit close together but don't fully overlap, which is a small thing, but not nothing, given the sample sizes involved.

3.4. Publication Bias

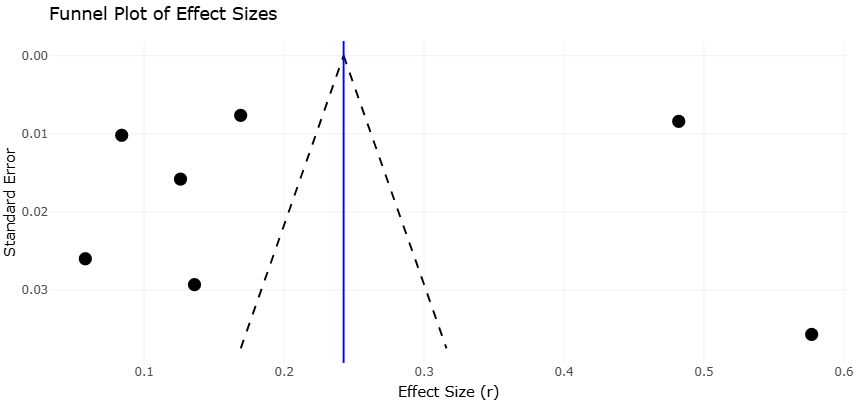
Two funnel plots were used to check whether these pooled estimates might be inflated by selective publication. Figure 3, plotting effect size against standard error for the Table 1 relationships, shows a reasonably even scatter around the pooled center line, though a couple of studies — including, notably, the greenentrepreneurship–performance pair with its unusually large effect — sit further out toward the wide end of the funnel than one would ideally like. Whether that reflects genuine variability or something closer to small-study effects is hard to say from a funnel plot with only a

Figure 2. Pooled Effect Sizes (r) with 95% Confidence Intervals for the Seven CSR/ESG–Performance Relationships (Bar-Chart View). Bar/point chart of the same seven relationships reported in Table 1 (e.g., ESG→financial performance, CSR→customer satisfaction), with error bars showing the 95% confidence interval around each pooled correlation.


Figure 3. Effect-Size Comparison Across CSR/ESG–Performance Relationships, Ranked by Strength of Association. A second visualization of the Table 1 effect sizes, arranged to compare relative magnitude across the seven relationships.

handful of points; we'd rather flag the ambiguity than resolve it artificially.

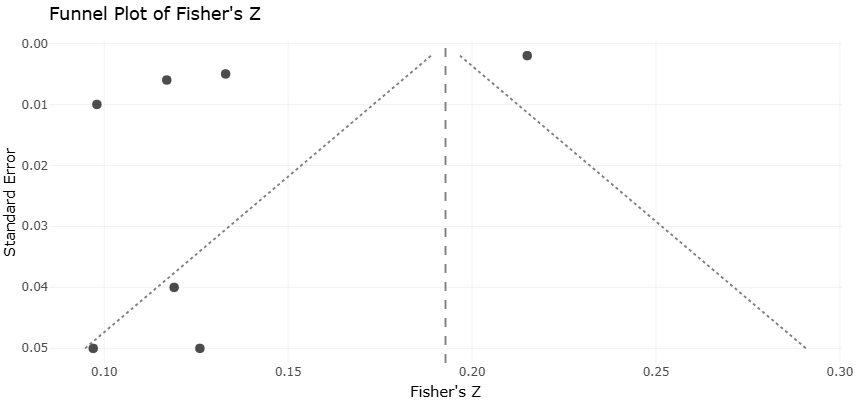
Figure 5, the equivalent funnel plot for the Fisher's Z estimates underlying Table 2, tells a broadly similar story — most points cluster reasonably close to the funnel's expected shape, with one or two outliers pulling toward the edges. Combined with the fail-safe N of over 12,000 for board independence (Table 2; Ortas et al., 2017), the overall impression is that publication bias, while not absent, is probably not severe enough to overturn the substantive conclusions above. That said, "probably not severe" is doing some work in that sentence, and we'd stop short of calling this evidence definitive.

3.5. Taken Together

Pulling back from the individual numbers, a fairly consistent pattern does emerge, even if it's not a tidy one. CSR and ESG engagement, across every relationship examined here, show a positive — never negative — association with financial, social, or reputational outcomes (Table 1). The magnitude of that association, though, swings from barely-there (ESG–financial performance general, r = .058) to genuinely large (CSR–customer satisfaction, r = .482), and the heterogeneity statistics in Table 2 make clear that a single "true" CSR–FP effect probably doesn't exist in any meaningful sense — what exists, instead, is a family of related but distinct relationships, each shaped by its own measurement choices, industry context, and geography (Barnett, 2007; Chininga et al., 2024). Whether that variability is a limitation of the evidence base or simply an honest reflection of how contingent the CSR–FP relationship really is, is a question we'll pick up again in the Discussion.

4.Discussion

The findings of this meta-analysis contribute to the long-standing and still unresolved debate concerning the relationship between corporate social responsibility (CSR), environmental, social, and governance (ESG) practices, and firm-level financial outcomes. By synthesizing effect sizes across multiple empirical contexts, the results provide robust evidence that ESG and CSR dimensions are associated with financial performance in statistically meaningful but highly heterogeneous ways. This heterogeneity is not a weakness of the analysis; rather, it reflects the contextual, strategic, and institutional complexity emphasized across CSR and stakeholder theory scholarship (Freeman, 1984; Barnett, 2007; Aguinis & Glavas, 2012).

The overall pooled effects suggest a modest positive association between ESG engagement and financial performance, consistent with prior meta-analytic and large-sample studies that frame CSR as a value-enhancing strategic investment rather than a cost (Charlo et al., 2017; Nguyen et al., 2022; Lemana et al., 2025). These findings align with resource-based and natural-resource-based views of the firm, which posit that socially and environmentally responsible practices can generate rare, inimitable, and non-substitutable resources such as reputation, legitimacy, and stakeholder trust (Barney, 1991; Hart, 1995). From this perspective, ESG activities function as strategic assets that strengthen long-term competitive advantage rather than merely fulfilling ethical obligations.

At the same time, the substantial heterogeneity indicators reported in Table 2 caution against assuming a universal or linear ESG–financial performance relationship. This variability resonates with Barnett’s (2007) stakeholder influence capacity framework, which argues that firms differ in their ability to convert CSR investments into financial returns depending on stakeholder relationships, industry visibility, and institutional pressures. The dispersion of effect sizes observed across studies supports the notion that ESG outcomes are contingent rather than deterministic. Firms operating in highly regulated or stakeholder-sensitive environments may experience stronger financial returns from ESG investments, while others may see neutral or even negative short-term effects, particularly when CSR initiatives are poorly aligned with core strategy (Barnea & Rubin, 2010; Lin, 2024).

The differentiated effects across ESG dimensions shown in Table 1 further refine this interpretation. Environmental and social dimensions tend to exhibit more consistent positive associations with financial performance than governance alone, a pattern echoed in prior empirical research (Alshehhi et al., 2018; Bai & Kim, 2024). Environmental initiatives often produce cost efficiencies, risk mitigation, and innovation benefits, particularly in resource-intensive industries (Porter, 1991; Öztürk et al., 2024). Social initiatives, especially those directed toward employees and communities, can enhance productivity, commitment, and corporate reputation, reinforcing financial outcomes over time

Figure 4. Forest plot of heterogeneity (I²) and Standard Error of Effect-Size Estimates Across ESG Dimensions and Regions (Bar-Chart View). Visualizes the Table 2 diagnostics — I² and standard error — for each ESG dimension and CSR-disclosure region, showing where between-study variability is highest.

Figure 5. Plot Assessing Publication Bias in Fisher's Z Effect Sizes, This funnel plot displays the distribution of Fisher's Z-transformed effect sizes against their standard errors across included studies. The dashed vertical line represents the pooled effect estimate, while the dotted diagonal lines denote the expected 95% confidence boundaries under the assumption of no publication bias. Asymmetry or gaps within the funnel may indicate potential small-study effects or publication bias in the meta-analytic sample.

(Boccia & Sarnacchiaro, 2018; Maya, 2024). Governance effects, by contrast, appear more context-dependent, potentially reflecting differences in national institutional frameworks and investor expectations (Chininga et al., 2024; Passas, 2024).

These findings also help reconcile competing theoretical perspectives within the CSR literature. Friedman’s (1970) shareholder primacy argument suggests that CSR activities may dilute managerial focus and erode shareholder value. While this view remains influential, the results suggest that, on average, ESG engagement does not undermine financial performance and may enhance it under favorable conditions. Instrumental stakeholder theory offers a more integrative explanation, proposing that ethical treatment of stakeholders ultimately supports firm performance through reduced conflict, enhanced cooperation, and reputational gains (Jones, 1995). The observed heterogeneity supports this instrumental view by indicating that financial benefits materialize when stakeholder engagement is authentic, strategically embedded, and responsive to stakeholder expectations (Ioannou & Serafeim, 2015; Awa et al., 2024).

The results also lend support to the shared value framework advanced by Porter and Kramer (2011), which argues that firms can simultaneously advance social progress and economic success by addressing societal challenges through core business strategies. The modest but positive pooled effects are consistent with this proposition, particularly when ESG initiatives are integrated into value creation processes rather than treated as peripheral or symbolic activities. However, the variability suggests that shared value creation is not automatic and depends on managerial capability, strategic coherence, and institutional alignment (Bebbington & Unerman, 2018; Knudsen & Moon, 2022).

Another important implication of the findings concerns the temporal dimension of ESG performance. Prior research highlights the “chicken–egg” problem in CSR and financial performance, where causality may run in both directions (Abid, 2023). The present results, while not resolving causality definitively, indicate that the ESG–financial performance relationship is unlikely to be purely spurious. Instead, the consistency of positive average effects across diverse contexts suggests a reinforcing dynamic in which financially successful firms are better positioned to invest in ESG, and effective ESG engagement further supports long-term financial stability (Fombrun & Shanley, 1990; Hategan et al., 2018).

Contextual factors such as industry, geography, and institutional development also appear to shape ESG outcomes. Evidence from emerging markets, including South Africa and Eastern Europe, indicates that ESG effects may differ in environments characterized by higher inequality, regulatory gaps, or stakeholder vulnerability (Chininga et al., 2024; McKeever, 2024). These contextual sensitivities likely contribute to the heterogeneity observed in Table 2 and underscore the need for more geographically diverse and institutionally informed ESG research. They also reinforce calls to move beyond one-size-fits-all ESG metrics toward context-sensitive evaluation frameworks (Barauskaite & Streimikiene, 2021; Kaźmierczak, 2022).

Finally, the findings highlight important implications for future research and practice. The heterogeneity observed across studies suggests that linear models may be insufficient to capture the complexity of ESG–financial performance relationships. Recent evidence of curvilinear effects, where excessive or poorly targeted CSR investments may reduce returns, aligns with this interpretation (Lin, 2024). Future research should therefore explore nonlinear dynamics, interaction effects, and time-lagged relationships to better understand when and how ESG creates value. For practitioners, the results emphasize that ESG should be treated as a strategic process rather than a compliance exercise, requiring alignment with stakeholder expectations, corporate capabilities, and long-term objectives.

In sum, the evidence supports a balanced and contingent interpretation of ESG and CSR performance. ESG engagement is neither a guaranteed path to superior financial performance nor an inherent threat to shareholder value. Instead, it functions as a strategic lever whose effectiveness depends on context, execution quality, and stakeholder integration, reinforcing the central insights of stakeholder theory and shared value scholarship.


5.Limitations

This study has several limitations that should be considered when interpreting the findings. First, despite the use of rigorous meta-analytic techniques, the included studies exhibit substantial heterogeneity, indicating that contextual differences across industries, countries, and institutional settings may influence the ESG–financial performance relationship. While random-effects models account for this variability statistically, they cannot fully capture unobserved moderators such as corporate culture or managerial intent. Second, most primary studies rely on secondary ESG ratings, which vary in methodology and may introduce measurement inconsistency across samples. Third, the predominance of cross-sectional designs limits causal inference and makes it difficult to disentangle whether ESG engagement drives financial performance or vice versa. Fourth, although publication bias assessments suggest reasonable robustness, the exclusion of non-English and unpublished studies may have resulted in omitted evidence. Finally, the aggregation of diverse ESG dimensions may mask nuanced effects at the indicator level, warranting more granular future analyses.

6.Conclusion

This study provides meta-analytic evidence that ESG and CSR practices are associated with modest but positive financial performance outcomes, while exhibiting substantial contextual variability. The findings support stakeholder and shared value theories, suggesting that ESG creates value when strategically integrated rather than symbolically adopted. High heterogeneity underscores the importance of industry, institutional, and governance contexts in shaping outcomes. Overall, ESG should be viewed as a contingent strategic investment that enhances long-term competitiveness when aligned with firm capabilities and stakeholder expectations.

References


Abid, R. (2023). Corporate social (ir)responsibility towards employees and financial performance: Using time to solve the chicken–egg problem. Review of Managerial Science. https://doi.org/10.1007/s11846-022-00541-9

Aguinis, H., & Glavas, A. (2012). What we know and don’t know about corporate social responsibility: A review and research agenda. Journal of Management, 38(4), 932–968. https://doi.org/10.1177/0149206311436079

Alshehhi, A., Nobanee, H., & Khare, N. (2018). The impact of sustainability practices on corporate financial performance. Sustainability, 10(2), 494. https://doi.org/10.3390/su10020494

Arian, A., Sands, J., & Tooley, S. (2023). Industry and stakeholder impacts on CSR and financial performance. Sustainability, 15(16), 12254. https://doi.org/10.3390/su151612254

Awa, H. O., et al. (2024). Stakeholders, stakeholder theory and corporate social responsibility. International Journal of Corporate Social Responsibility. https://doi.org/10.1186/s40991-024-00094-y

Bai, H., & Kim, J. (2024). Do ESG practices promote financial performance? Comparison of English, Chinese, and Korean papers through bibliometric and meta-analysis. Sustainability, 16(22), 9810.  https://doi.org/10.3390/su16229810

Barauskaite, G., & Streimikiene, D. (2021). Corporate social responsibility and financial performance: The puzzle of concepts. Corporate Social Responsibility and Environmental Management, 28(1), 278–287. https://doi.org/10.1002/csr.2048

Barnea, A., & Rubin, A. (2010). Corporate social responsibility as a conflict between shareholders. Journal of Business Ethics, 97(1), 71–86. https://doi.org/10.1007/s10551-010-0496-z

Barnett, M. L. (2007). Stakeholder influence capacity and the variability of financial returns to CSR. Academy of Management Review, 32(3), 794–816. https://doi.org/10.5465/amr.2007.25275520

Barney, J. (1991). Firm resources and sustained competitive advantage. Journal of Management, 17(1), 99–120. https://doi.org/10.1177/014920639101700108

Bebbington, J., & Unerman, J. (2018). Achieving the United Nations Sustainable Development Goals. Accounting, Auditing & Accountability Journal, 31(1), 2–24. https://doi.org/10.1108/AAAJ-05-2017-2929

Boccia, F., & Sarnacchiaro, P. (2018). The impact of corporate social responsibility on consumer preference. Corporate Social Responsibility and Environmental Management, 25(1), 151–163. https://doi.org/10.1002/csr.1446

Carroll, A. B. (1991). The pyramid of corporate social responsibility. Business Horizons, 34(4), 39–48. https://doi.org/10.1016/0007-6813(91)90005-G

Charlo, M. J., Moya, I., & Muñoz, A. M. (2017). Financial performance of socially responsible firms. Sustainability, 9(9), 1622. https://doi.org/10.3390/su9091622

Chi, H.-K., & Phan, H.-T. (2025). Revealing the role of corporate social responsibility, service quality, and perceived value in determining customer loyalty: A meta-analysis study. Sustainability, 17(10), 4304.

Chininga, E., et al. (2024). ESG ratings and corporate financial performance in South Africa. Journal of Accounting in Emerging Economies. https://doi.org/10.1108/JAEE-03-2023-0072

Fombrun, C. J., & Shanley, M. (1990). What’s in a name? Reputation building and corporate strategy. Academy of Management Journal, 33(2), 233–258. https://doi.org/10.5465/256324

Freeman, R. E. (1984). Strategic management: A stakeholder approach. Pitman. https://doi.org/10.1017/CBO9781139192668

Friedman, M. (1970). The social responsibility of business is to increase its profits. The New York Times Magazine. http://umich.edu/~thecore/doc/Friedman.pdf

Gallardo-Vázquez, D., Barroso-Méndez, M. J., Pajuelo-Moreno, M. L., & Sánchez-Meca, J. (2019). Corporate social responsibility disclosure and performance: A meta-analytic approach. Sustainability, 11(4), 1115.

Guerrero-Villegas, J., et al. (2018). Board attributes and CSR disclosure. Sustainability, 10(12), 4808. https://doi.org/10.3390/su10124808

Guerrero-Villegas, J., Pérez-Calero, L., Hurtado-González, J. M., & Giráldez-Puig, P. (2018). Board attributes and corporate social responsibility disclosure: A meta-analysis. Sustainability, 10(12), 4808.

Hart, S. L. (1995). A natural-resource-based view of the firm. Academy of Management Review, 20(4), 986–1014. https://doi.org/10.5465/amr.1995.9512280033

Hategan, C. D., et al. (2018). Relationship between CSR and profit in Romanian companies. Sustainability, 10(4), 1041. https://doi.org/10.3390/su10041041

Ioannou, I., & Serafeim, G. (2015). The impact of CSR on investment recommendations. Strategic Management Journal, 36(7), 1053–1081. https://doi.org/10.1002/smj.2269

Jensen, M. C., & Meckling, W. H. (1976). Theory of the firm. Journal of Financial Economics, 3(4), 305–360. https://doi.org/10.1016/0304-405X(76)90026-X

Jones, T. M. (1995). Instrumental stakeholder theory. Academy of Management Review, 20(2), 404–437. https://doi.org/10.5465/amr.1995.9508080330

Kazmierczak, M. (2022). CSR versus ESG: A literature review. Scientific Papers of Silesian University of Technology. https://doi.org/10.29117/sbe.2022.0162

Knudsen, J. S., & Moon, J. (2022). Corporate social responsibility and government. Business Ethics Quarterly. https://doi.org/10.1017/beq.2021.16

Lemana, P., Matemane, R., & Mokabane, M. (2025). Corporate social responsibility as a driver of financial performance. Journal of Risk and Financial Management, 18(5), 278. https://doi.org/10.3390/jrfm18050278

Lin, W. L. (2024). Too little of a good thing? Curvilinear effects of CSR on FP. Review of Managerial Science.

Maya, M. (2024). The importance of corporate social responsibility in social value creation. Business & Society. https://doi.org/10.1142/9789811286674_0007

McKeever, M. (2024). Social stratification and inequality in South Africa. Sociology Compass. https://doi.org/10.1111/soc4.13173

Nguyen, C. T., et al. (2022). Corporate social responsibility and financial performance. Cogent Economics & Finance. https://doi.org/10.1080/23322039.2022.2075600

Ortas, E., Álvarez, I., & Zubeltzu, E. (2017). Firms’ board independence and corporate social performance: A meta-analysis. Sustainability, 9(6), 1006.

Öztürk, R., et al. (2024). Green entrepreneurial orientation and firm performance. Sustainability, 16(24), 11224. https://doi.org/10.3390/su162411224

Öztürk, R., Öztürk, M., & Kizilkan, Z. (2024). Meta-analysis of the relationship between green entrepreneurial orientation and sustainable firm performance. Sustainability, 16(24), 11224.

Passas, I. (2024). The evolution of ESG. Encyclopedia. https://doi.org/10.3390/encyclopedia4040112

Porter, M. E. (1991). America’s green strategy. Scientific American, 264(4), 168. https://doi.org/10.1038/scientificamerican0491-168

Porter, M. E., & Kramer, M. R. (2011). Creating shared value. Harvard Business Review. https://hbr.org/2011/01/the-big-idea-creating-shared-value

Xu, H., Mei, Q., Shahzad, F., Liu, S., Long, X., & Zhang, J. (2020). Untangling the impact of green finance on the enterprise green performance: A meta-analytic approach. Sustainability, 12(21), 9085.


Article metrics
View details
0
Downloads
0
Citations
31
Views

View Dimensions


View Plumx


View Altmetric


0
Save
0
Citation
31
View
0
Share