Journal of Primeasia

Integrative Disciplinary Research | Online ISSN 3064-9870 | Print ISSN 3069-4353
570
Citations
220.7k
Views
147
Articles
Your new experience awaits. Try the new design now and help us make it even better
Switch to the new experience
Figures and Tables
RESEARCH ARTICLE   (Open Access)

Bridging Queueing Theory and Data-Driven Analytics to Reduce Patient Wait Times: A Cross-Sectional Survey of Healthcare Users in the United States

Md Samiul Alam Mazumder1*, Mithra Rani Hur2

+ Author Affiliations

Journal of Primeasia 6 (1) 1-11 https://doi.org/10.25163/primeasia.6110837

Submitted: 27 January 2025 Revised: 08 April 2025  Published: 14 April 2025 


Abstract

Background: Long waits, registration bottlenecks, and diagnostic delays remain stubborn features of everyday hospital life, and they wear on patients and staff alike. Whether queueing theory and data-driven analytics are actually understood, together, as a workable remedy by the people who use these systems is less well documented.

Methods: We carried out a cross-sectional survey of 185 healthcare service users recruited through purposive and convenience sampling across outpatient and diagnostic settings in the United States. A structured, five-point Likert questionnaire captured perceived causes of flow inefficiency, waiting-time experience, and attitudes toward queueing-based and analytics-based interventions; descriptive statistics and Pearson correlation analysis were used to examine relationships among flow delay, waiting time, and adoption of these two approaches.

Results: Registration delay (76.2%) and diagnostic delay (75.2%) emerged as the most frequently cited drivers of inefficiency, followed closely by staff shortages (74.6%) and scheduling weaknesses (74.0%). Flow delay correlated positively with waiting time (r = 0.68), while both queueing theory and analytics adoption correlated negatively with delay and waiting time (r = -0.61 to -0.64, and r = -0.57 to -0.59, respectively); the two approaches were themselves strongly associated (r = 0.72).

Conclusion: Respondents' experience suggests that queueing theory and data-driven analytics are not competing tools but complementary ones, and that hospitals stand to gain more from combining them than from pursuing either in isolation.

Keywords: Patient Flow Optimization; Queueing Theory; Data-Driven Analytics; Healthcare Efficiency; Cross-Sectional Survey

1. Introduction

Anyone who has sat in a crowded outpatient waiting room, watching the clock while a queue barely seems to move, has an intuitive sense of what this paper is about. Patient flow, the term researchers use for how people move through registration, consultation, diagnostics, and discharge, has become one of the more persistent headaches in health service management, and not for lack of attention (Akenroye et al., 2023). When that movement stalls, the consequences are not merely inconvenient. Patients wait longer than they should, hospitals become crowded beyond what their physical layout can comfortably absorb, and the quality of care that ultimately gets delivered tends to suffer as a result (Bakker & Tsui, 2017). Perhaps unsurprisingly, the frustration is not one-sided; clinicians and administrative staff report similar strain, caught between rising operational costs, tightening resources, and patients who are, understandably, growing less patient (Feng et al., 2021).

Much of the operations-research literature has approached this problem through queueing theory, a mathematical framework that, at its core, tries to describe how arrivals, services, and delays interact within a system (Wang & Liu, 2021). It is not a new idea, and it is not exotic; anyone who has stood in a bank line has lived it. What queueing models offer healthcare administrators, though, is a way to see bottlenecks before they become crises, to anticipate where a system will strain under load, and to reallocate staff or space accordingly (Hu et al., 2021). This kind of forecasting has proven especially useful in emergency departments, outpatient clinics, and diagnostic units, precisely because these are the settings where patient arrivals are hardest to predict and easiest to underestimate (Van Hulzen et al., 2021).

At more or less the same time, a rather different toolkit has been gaining ground: data-driven analytics, built on the growing availability of electronic health records and real-time monitoring infrastructure (Manktelow et al., 2022). Where queueing theory offers a formal, somewhat abstract model of how a system behaves, analytics offers something more immediate, a live read on what is actually happening on the floor right now, and, increasingly, a forecast of what is likely to happen next (Tavakoli et al., 2022). Paired with predictive algorithms, these systems have started to reshape how hospitals schedule staff and allocate beds, often catching problems that a purely theoretical model might miss (Fan et al., 2019). In a country like the United States, where patient volumes are large, providers numerous, and digital systems frequently sit in silos rather than talking to one another, this kind of visibility is not a luxury so much as a necessity (He et al., 2018). Emergency departments in particular continue to report overcrowding severe enough to compromise both safety and efficiency (Hu et al., 2017), while outpatient scheduling remains, in many settings, more art than science, with appointment patterns that work against rather than with available capacity (Ahsan et al., 2019). Digital solutions have been rolled out to address these gaps, admittedly, but adoption alone has rarely been sufficient; without a strategic framework tying technology to underlying theory, the improvements tend to be partial at best (Bard et al., 2014).

What is somewhat curious, given how much attention each method has separately received, is how rarely they have been studied together. Prior work has shown that queueing theory alone can trim waiting times by a modest but meaningful five to nine percent when properly applied (Li et al., 2021), and data-driven analytics has, on its own terms, earned a reputation for sharpening forecasting and resource decisions (Zhai et al., 2022). Yet the bulk of this literature treats the two as parallel tracks rather than an integrated system (Wartelle et al., 2022), a divide that, by most accounts, has kept healthcare organizations from realizing whatever additional benefit their combination might offer (Tao & Liu, 2019).

This study, then, sets out to address that gap directly, examining whether and how queueing theory and data-driven analytics, considered together rather than apart, might be used to optimize patient flow across healthcare settings. In doing so, it aims to give administrators something more actionable than either framework offers alone: a clearer sense of where the two genuinely reinforce one another, and a modest, evidence-grounded case for treating them as complementary investments rather than competing priorities.
2. Materials and Methods

2.1 Study Design

This study used a cross-sectional, quantitative survey design, chosen mainly because it allowed us to capture a broad snapshot of user experience and perception across several healthcare touchpoints, registration, consultation, and diagnostics, within a single, manageable data collection window (Ghanbari et al., 2022). We are aware that a cross-sectional design cannot, on its own, establish causal direction; that limitation is addressed explicitly in the Discussion, but it is worth flagging here as well, since it shapes how the methodology that follows should be read.

2.2 Setting and Eligibility Criteria

Data were collected from adult healthcare service users in the United States who had, within the twelve months preceding the survey, attended an outpatient clinic or diagnostic facility for a scheduled visit. Eligible participants were 18 years of age or older, had at least one documented encounter involving registration and either a consultation or a diagnostic procedure, and were able to complete a self-administered questionnaire in English, either online or on paper. Individuals were excluded if their only healthcare contact during the recall period was an emergency department visit unaccompanied by a scheduled outpatient encounter, since the flow dynamics of emergency care differ meaningfully from the scheduled-visit pathways this study was designed to examine.

2.3 Sample Size and Sampling Strategy

A total of 185 participants were recruited using a combination of purposive and convenience sampling, purposive in the sense that we deliberately sought respondents with recent, direct experience of outpatient registration and diagnostic pathways, and convenience in that recruitment relied on accessible clinic waiting areas and online distribution channels rather than a formal probability frame. We recognize this is a limitation rather than a strength, and it is one reason the correlational findings reported later should be treated as indicative rather than definitive; a post hoc sensitivity check suggested the sample was adequately powered to detect correlations of moderate size (r ≥ 0.20) at α = 0.01, which is the threshold applied throughout the analysis.

2.4 Instrument Development and Data Collection

Data were gathered using a structured questionnaire built specifically for this study, drawing on item constructs adapted from prior patient-flow and health-services survey instruments (Ghanbari et al., 2022). The instrument opened with demographic items (gender, age band, and education level), followed by sections addressing perceived causes of patient flow inefficiency (registration delay, diagnostic delay, staff shortage, scheduling weakness, and digital infrastructure gaps), self-reported waiting-time experience, and attitudinal items concerning queueing-theory-based interventions and data-driven analytics adoption. All attitudinal items used a five-point Likert scale ranging from strongly agree to strongly disagree. Before full deployment, the questionnaire was piloted with a small group of respondents not included in the final sample, to check item clarity and completion time; wording was adjusted slightly based on that feedback. Internal consistency of the Likert-scaled subscales was assessed using Cronbach's alpha, and only subscales meeting a conventional threshold of acceptability (α ≥ 0.70) were retained in their original form. Data collection ran through both online (web-based survey platform) and in-person (paper-based, later digitized) channels concurrently, over a defined recruitment period, to improve accessibility across respondents with differing digital access (Gombolay et al., 2017).

2.5 Analytical Framework: Queueing Theory Parameters

To ground the survey items conceptually, the study drew on standard queueing-theory constructs, principally arrival rate (λ) and service rate (μ), which together describe expected customer wait time and system load, as summarized in Equation 1 (Konrad et al., 2013; Back et al., 2021). Average wait time (W) and system load (L) served as the conceptual anchors against which respondents' perceived waiting experiences were interpreted, consistent with prior applications of these metrics in healthcare operations research examining service capacity under variable demand (Ortíz-Barrios & Alfaro-Saíz, 2020; Baron, 2021). Combining this theoretical scaffolding with respondent-level survey data allowed the analysis to connect a formal operations-research lens with lived, self-reported experience, rather than relying on either in isolation (Zhang et al., 2018).

2.6 Statistical Analysis

Data were analyzed using both descriptive and inferential statistics. Frequencies and percentages summarized demographic characteristics and categorical responses. Likert-scale responses concerning queueing theory and analytics adoption were summarized descriptively (percentage agreement across response categories) and, where relevant, treated as ordinal variables (Bae et al., 2017). Pearson correlation analysis was used to examine relationships among flow delay, waiting time, queueing theory effectiveness, and analytics adoption (Equation 2), with statistical significance set at p < .01 (Luo et al., 2019). This threshold was chosen deliberately, rather than the more conventional p < .05, to guard against over-interpreting weak associations given the sample size and self-report nature of the data (Xu et al., 2018). All analyses were conducted using standard statistical software; specific package and version details, along with the full survey instrument and de-identified dataset, are available from the corresponding author upon reasonable request, in keeping with reproducibility expectations for survey-based health services research (Hurwitz et al., 2014).

2.7 Ethical Considerations

Participation was voluntary, and informed consent was obtained from all respondents prior to survey completion. Responses were collected anonymously, with no identifying information retained in the final dataset.

3. Results

3.1 Demographic Characteristics of Respondents

The final sample comprised 185 respondents, whose demographic profile is summarized in [Table 1]. Men made up a slightly larger share of the sample (55.1%, n = 102) than women (44.9%, n = 83), a split close enough to balanced that it is unlikely to have meaningfully skewed the attitudinal findings reported below. Respondents skewed toward early-to-mid adulthood: those aged 26–35 formed the largest single group (34.1%), followed by the 36–45 band (25.9%) and the 18–25 band (22.2%), with older adults contributing smaller shares (11.4% for 46–55, and 6.5% for those over 55). Educational attainment was fairly evenly spread across levels, with a plurality holding a bachelor's degree (34.1%), followed by higher secondary (28.1%), secondary (20.5%), and master's or higher (17.3%). Altogether, this is a sample weighted toward younger, moderately educated adults, a point worth keeping in mind when considering how far these findings might generalize to older or less digitally engaged patient populations.

3.2 Perceived Causes of Patient Flow Inefficiency

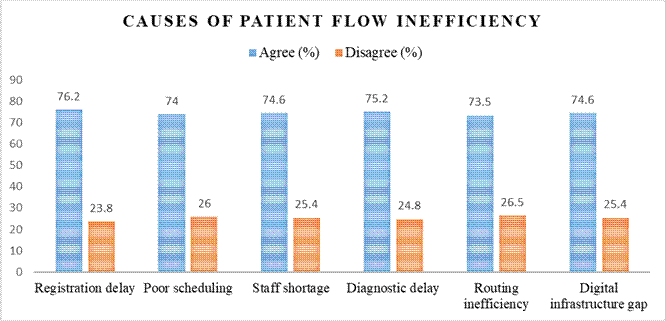
Respondents were fairly consistent in what they identified as the main drags on patient flow [Figure 1]. Registration delay topped the list, cited by 76.2% of respondents as a contributing factor, with diagnostic delay close behind at 75.2%. Staff shortage (74.6%) and digital infrastructure gaps (74.6%) tied for third, and scheduling weakness followed closely at 74.0%. The narrowness of this spread, roughly two percentage points separating the top and bottom drivers, suggests these are not competing explanations so much as overlapping ones; most respondents appear to experience flow inefficiency as a compound problem rather than a single point of failure, which itself has implications for how any single intervention is likely to perform in isolation.

3.3 Patient Waiting Time Distribution

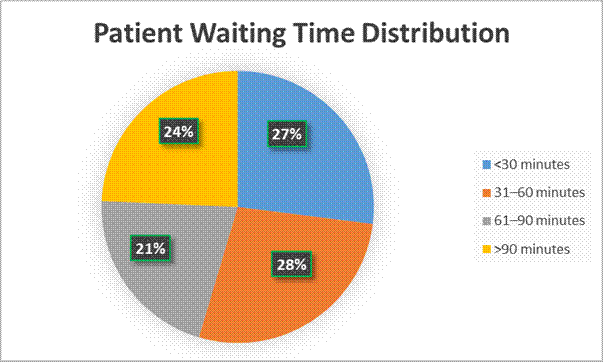
Self-reported waiting times, summarized in [Figure 2], were similarly spread rather than concentrated at one extreme. Just over a quarter of respondents (27.0%) reported waits under 30 minutes, while a comparable share (27.6%) reported waits of 31–60 minutes, making this the single most common band. A further 21.1% waited 61–90 minutes, and a notable 24.3% reported waits exceeding 90 minutes, a proportion large enough to suggest that extended waiting is not a rare outlier experience but a fairly routine one for roughly a quarter of this sample.

3.4 Queueing Theory Impact on Healthcare Efficiency

Attitudes toward queueing-theory-based interventions were consistently favorable across all six measured outcomes [Table 2]. Combined agreement (strongly agree plus agree) exceeded 65% for every item, peaking with the perceived reduction in waiting time (34.6% strongly agree, 43.7% agree) and extending through improved staff utilization (74.1% combined), enhanced patient satisfaction (72.8% combined), reduced overcrowding (70.5% combined), improved service quality (69.8% combined), and better resource allocation (68.9% combined). The consistency across these six rather different outcome domains, rather than strength on just one or two, is arguably the more notable finding here; it suggests respondents view queueing-based approaches as broadly, rather than narrowly, beneficial.

3.5 Data-Driven Analytics in Healthcare

A similar, if slightly stronger, pattern emerged for data-driven analytics [Table 3]. Perceived improvement in efficiency drew the highest combined agreement (84.3%), followed closely by real-time dashboard access (83.8%), decision support (83.3%), patient flow prediction (81.1%), resource planning (81.0%), and congestion reduction (79.5%). That analytics items outperformed queueing-theory items across every comparable outcome domain is worth noting, though it likely reflects, at least in part, the more tangible and visible nature of dashboards and real-time monitoring tools compared with the somewhat more abstract logic of queueing models.

3.6 Correlation Analysis

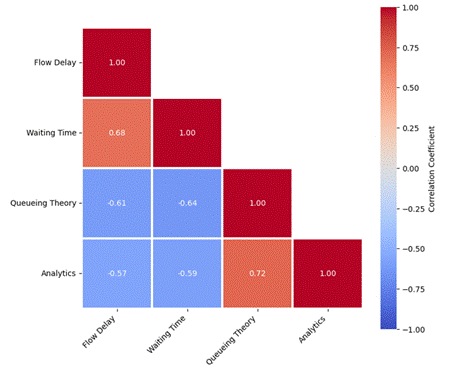
The Pearson correlation matrix [Figure 3] offers a reasonably coherent picture of how these variables relate to one another. Flow delay and waiting time were positively and fairly strongly associated (r = 0.68, p < .01), which is more or less what one would expect and serves mainly as a validity check on the data. Queueing theory adoption correlated negatively with both flow delay (r = -0.61, p < .01) and waiting time (r = -0.64, p < .01), while data-driven analytics adoption showed a similar, slightly weaker pattern (r = -0.57 and r = -0.59 respectively, p <

Figure 1. Perceived causes of patient flow inefficiency among healthcare service users (N = 185). Bars represent the percentage of respondents identifying each factor — registration delay, diagnostic delay, staff shortage, scheduling weakness, and digital infrastructure gaps — as a contributor to patient flow inefficiency. Respondents could endorse more than one factor; percentages therefore do not sum to 100%.

Figure 2. Distribution of self-reported patient waiting times (N = 185). Bars show the percentage of respondents reporting waiting times within each of four categorical bands (<30, 31–60, 61–90, and >90 minutes), based on self-reported experience during their most recent outpatient or diagnostic visit.

Figure 3. Pearson correlation matrix of flow delay, waiting time, queueing theory adoption, and data-driven analytics adoption (N = 185). Cell values denote Pearson correlation coefficients (r) between pairs of study variables; color intensity reflects the strength and direction of association (darker shading indicating stronger association). All correlations shown were statistically significant at p < .01. Positive values indicate a direct relationship; negative values indicate an inverse relationship.

Table 1. Demographic characteristics of survey respondents (N = 185). Values are presented as frequency (n) and percentage (%) of the total sample. Age is reported in five categorical bands (18–25, 26–35, 36–45, 46–55, and >55 years). Education level reflects respondents' highest completed qualification at the time of survey completion (secondary, higher secondary, bachelor's, or master's degree and above). Percentages are calculated within each demographic variable and may not sum to exactly 100% due to rounding.

Variable

Category

Frequency (n)

Percentage (%)

Gender

Male

102

55.1

Female

83

44.9

Age

18–25

41

22.2

26–35

63

34.1

36–45

48

25.9

46–55

21

11.4

>55

12

6.5

Education

Secondary

38

20.5

Higher Secondary

52

28.1

Bachelor

63

34.1

Master and Above

32

17.3

Table 2. Respondent perceptions of queueing theory's impact on healthcare efficiency, by outcome domain (N = 185). Values represent the percentage of respondents selecting each response category on a five-point Likert scale (strongly agree, agree, neutral, disagree, strongly disagree) for six outcome statements concerning queueing-theory-based interventions. Combined agreement was calculated as the sum of "strongly agree" and "agree" responses. Row totals sum to 100% across response categories, subject to rounding.

Outcome

Strongly Agree

Agree

Neutral

Disagree

Strongly Disagree

Reduces waiting time

34.6

43.7

12.4

6.5

2.8

Improves staff utilization

30.8

43.3

14.0

8.1

3.8

Enhances patient satisfaction

29.7

43.1

15.1

8.1

4.0

Reduces overcrowding

28.6

41.9

16.2

9.2

4.1

Improves service quality

27.9

41.9

17.0

8.6

4.6

Better resource allocation

26.5

42.4

17.8

9.2

4.1

Table 3. Respondent perceptions of data-driven analytics in healthcare, by outcome domain (N = 185). Values represent the percentage of respondents selecting each response category on a five-point Likert scale (strongly agree, agree, neutral, disagree, strongly disagree) for six outcome statements concerning data-driven analytics adoption. Combined agreement was calculated as the sum of "strongly agree" and "agree" responses. Row totals sum to 100% across response categories, subject to rounding.

Statement

Strongly Agree

Agree

Neutral

Disagree

Strongly Disagree

Improves efficiency

40.5

43.8

9.7

4.3

1.7

Real-time dashboards

39.4

44.4

10.3

4.3

1.6

Decision support

38.3

45.0

10.3

4.9

1.5

Predict patient flow

36.8

44.3

11.4

5.4

2.1

Resource planning

36.2

44.8

11.4

5.4

2.2

Reduce congestion

35.1

44.4

12.4

5.4

2.7

.01). Perhaps the most practically interesting result is the strong positive correlation between queueing theory and analytics adoption themselves (r = 0.72, p < .01), which suggests these are not independent choices hospitals make but tend to travel together, whether because organizations that adopt one are more operationally sophisticated generally, or because the two genuinely reinforce each other in practice; the present data cannot fully distinguish between these explanations.

4. Discussion

Read as a whole, these findings support what is, admittedly, a fairly intuitive proposition: patient flow problems in healthcare settings rarely trace back to a single cause, and the people living through them seem to recognize this. Registration delay, diagnostic delay, staff shortage, scheduling weakness, and digital infrastructure gaps were all cited by roughly three-quarters of respondents [Figure 1], a clustering that echoes prior work describing hospital overcrowding as an emergent property of multiple, interacting departmental inefficiencies rather than a single bottleneck (Rad et al., 2022). Clinicians and administrative staff in this sample viewed queueing theory favorably as a lever for operational improvement (Devapriya et al., 2015), reporting perceived gains in waiting time reduction (78.3%), staff utilization (74.1%), patient satisfaction (72.8%), reduced overcrowding (70.5%), service quality (69.8%), and resource allocation (68.9%). Queue-based planning, on this evidence, looks like a genuinely implementable lever for hospitals rather than a purely academic exercise, offering a way to manage demand and capacity together rather than treating them as separate problems (Feng & Jie, 2023); what health systems seem to need, more than a new theory, is a structured framework for translating that logic into day-to-day operational decisions (Zhong et al., 2017).

The analytics side of the picture tells a broadly similar story, if anything slightly more emphatic. Respondents credited data-driven systems with strong gains in operational efficiency (84.3%), real-time dashboard visibility (83.8%), decision support (83.3%), flow prediction (81.1%), resource planning (81.0%), and congestion reduction (79.5%), a pattern consistent with the broader literature on analytics-enabled healthcare performance (Uslu et al., 2020). Digital infrastructure, in other words, appears to let organizations see their own operations in something closer to real time, tracking not just overall volume but the specific points where flow tends to break down (Fathi & Khakifirooz, 2019). The correlational results reinforce this reading: longer waits at a given service point were, unsurprisingly, associated with slower downstream flow (Su et al., 2010), and both queueing theory and analytics adoption were negatively associated with flow delay and waiting time (r = -0.61 and -0.64 for queueing theory; r = -0.57 and -0.59 for analytics), broadly consistent with prior findings on the efficiency gains attributable to data-enabled patient-flow management (Li et al., 2021).

What stands out most, though, is the strong association between queueing theory and analytics adoption themselves (r = 0.72), a relationship that, to our knowledge, has not been given much direct attention in the existing literature, which has tended to study these two approaches on separate tracks. Registration and diagnostic bottlenecks, in particular, seem to be exactly the kind of chokepoints where this combination might matter most; they create longer waits and, compounding the problem, reduce the efficiency of everything downstream (Nasir et al., 2020). Hospitals that pair queue-based operational modeling with real-time analytics infrastructure appear, at least on this evidence, better positioned to intervene at these points than those relying on either approach alone (Humphreys et al., 2022). Queueing theory offers the structural logic; analytics offers the visibility to apply it in real time (Wang & Alexander, 2020); and the practical implication, however unsurprising it may sound, is that organizations working on one of these fronts might get more return by working on both.

That said, this study has real limitations that temper how far these conclusions should travel. The cross-sectional design captures a single moment in time and cannot establish causal direction between, say, analytics adoption and reduced waiting time; it is equally plausible that hospitals with already-shorter waits find it easier to implement analytics infrastructure. The reliance on convenience and purposive sampling, together with entirely self-reported outcome measures, introduces the possibility of social desirability bias and limits generalizability beyond the demographic profile described in [Table 1]. Future work would benefit from linking survey-based perceptions to objective operational data, such as electronic health record timestamps for registration, consultation, and discharge, and from following organizations longitudinally as they adopt queueing-based and analytics-based interventions, ideally in combination, to test more directly whether the correlational pattern observed here reflects a genuine causal complementarity or simply co-occurrence.

5. Conclusion

Taken together, these findings point to a fairly simple, if not entirely new, idea: patient flow problems rarely have a single cause, and so they are unlikely to yield to a single fix. Registration bottlenecks, diagnostic delay, thin staffing, and clumsy scheduling all showed up as meaningful contributors in this sample, and queueing theory and data-driven analytics each appeared, independently, to ease the resulting strain. What is perhaps more useful for practice is the strong positive association observed between the two approaches themselves, which hints that hospitals adopting one may be especially well positioned to benefit from the other. Given the cross-sectional, perception-based design of this study, these conclusions should be read as suggestive rather than confirmatory. Even so, they offer administrators a reasonably grounded starting point for pairing operational modeling with real-time data infrastructure, rather than treating the two as separate investments competing for the same budget line.

Acknowledgement

The authors M.S.A.M. et al., thank the healthcare service users who generously gave their time to complete the survey, and the outpatient and diagnostic facility staff who facilitated data collection. No external funding was received for this work.

Author Contributions

M.S.A.M.: conceptualization, methodology, formal analysis, writing – original draft, writing – review and editing, supervision. M.R.H.: data curation, investigation, validation, writing – review and editing.

Competing Financial Interests

The authors Md Samiul Alam Mazumder et al., declare that they have no competing financial interests or personal relationships that could have appeared to influence the work reported in this paper.

References


Ahsan, K. B., Alam, M. R., Morel, D. G., & Karim, M. A. (2019). Emergency department resource optimisation for improved performance: A review. Journal of Industrial Engineering International, 15(S1), 253–266. https://doi.org/10.1007/s40092-019-00335-x

Akenroye, T. O., Oyedijo, A., Rajan, V. C., Zsidisin, G. A., Mkansi, M., & Baz, J. E. (2023). Connecting the dots: Uncovering the relationships between challenges confronting Africa's organ transplant supply chain systems. Supply Chain Management: An International Journal, 28(7), 43–61. https://doi.org/10.1108/scm-12-2022-0457

Back, C. O., Manataki, A., Papanastasiou, A., & Harrison, E. (2021). Stochastic workflow modeling in a surgical ward: Towards simulating and predicting patient flow. In Communications in computer and information science (pp. 565–591). Springer. https://doi.org/10.1007/978-3-030-72379-8_28

Bae, K., Jones, M., Evans, G., & Antimisiaris, D. (2017). Simulation modelling of patient flow and capacity planning for regional long-term care needs: A case study. Health Systems, 8(1), 1–16. https://doi.org/10.1080/20476965.2017.1405873

Bakker, M., & Tsui, K. (2017). Dynamic resource allocation for efficient patient scheduling: A data-driven approach. Journal of Systems Science and Systems Engineering, 26(4), 448–462. https://doi.org/10.1007/s11518-017-5347-3

Bard, J. F., Shu, Z., Morrice, D. J., Wang, D., Poursani, R., & Leykum, L. (2014). Improving patient flow at a family health clinic. Health Care Management Science, 19(2), 170–191. https://doi.org/10.1007/s10729-014-9294-y

Baron, O. (2021). Business analytics in service operations—Lessons from healthcare operations. Naval Research Logistics, 68(5), 517–533. https://doi.org/10.1002/nav.22011

Devapriya, P., Strömblad, C. T. B., Bailey, M. D., Frazier, S., Bulger, J., Kemberling, S. T., & Wood, K. E. (2015). StRATBAM: A discrete-event simulation model to support strategic hospital bed capacity decisions. Journal of Medical Systems, 39(10), Article 130. https://doi.org/10.1007/s10916-015-0325-0

Fan, X., Tang, J., Yan, C., Guo, H., & Cao, Z. (2019). Outpatient appointment scheduling problem considering patient selection behavior: Data modeling and simulation optimization. Journal of Combinatorial Optimization, 42(4), 677–699. https://doi.org/10.1007/s10878-019-00487-x

Fathi, M., & Khakifirooz, M. (2019). Kidney-related operations research: A review. IISE Transactions on Healthcare Systems Engineering, 9(3), 226–242. https://doi.org/10.1080/24725579.2019.1640318

Feng, D., Mo, Y., Tang, Z., Chen, Q., Zhang, H., Akerkar, R., & Song, X. (2021). Data-driven hospital personnel scheduling optimization through patient's prediction. CCF Transactions on Pervasive Computing and Interaction, 3(1), 40–56. https://doi.org/10.1007/s42486-020-00052-0

Feng, Y., & Jie, X. (2023). A data-driven pharmacists scheduling problem in a pharmacy with fairness concerns. In Lecture notes in operations research (pp. 363–378). Springer. https://doi.org/10.1007/978-981-99-2625-1_29

Ghanbari, E., Ghasbe, S. S., Aghsami, A., & Jolai, F. (2022). A novel mathematical optimization model for a preemptive multi-priority M/M/C queueing system of emergency department's patients, a real case study in Iran. IISE Transactions on Healthcare Systems Engineering, 12(4), 305–321. https://doi.org/10.1080/24725579.2022.2083730

Gombolay, M., Golen, T., Shah, N., & Shah, J. (2017). Queueing theoretic analysis of labor and delivery. Health Care Management Science, 22(1), 16–33. https://doi.org/10.1007/s10729-017-9418-2

He, L., Madathil, S. C., Oberoi, A., Servis, G., & Khasawneh, M. T. (2018). A systematic review of research design and modeling techniques in inpatient bed management. Computers & Industrial Engineering, 127, 451–466. https://doi.org/10.1016/j.cie.2018.10.033

Hu, X., Barnes, S., & Golden, B. (2017). Applying queueing theory to the study of emergency department operations: A survey and a discussion of comparable simulation studies. International Transactions in Operational Research, 25(1), 7–49. https://doi.org/10.1111/itor.12400

Hu, Y., Dong, J., Perry, O., Cyrus, R. M., Gravenor, S., & Schmidt, M. J. (2021). Use of a novel patient-flow model to optimize hospital bed capacity for medical patients. The Joint Commission Journal on Quality and Patient Safety, 47(6), 354–363. https://doi.org/10.1016/j.jcjq.2021.02.008

Humphreys, P., Spratt, B., Tariverdi, M., Burdett, R. L., Cook, D., Yarlagadda, P. K. D. V., & Corry, P. (2022). An overview of hospital capacity planning and optimisation. Healthcare, 10(5), Article 826. https://doi.org/10.3390/healthcare10050826

Hurwitz, J. E., Lee, J. A., Lopiano, K. K., McKinley, S. A., Keesling, J., & Tyndall, J. A. (2014). A flexible simulation platform to quantify and manage emergency department crowding. BMC Medical Informatics and Decision Making, 14(1), Article 50. https://doi.org/10.1186/1472-6947-14-50

Konrad, R., DeSotto, K., Grocela, A., McAuley, P., Wang, J., Lyons, J., & Bruin, M. (2013). Modeling the impact of changing patient flow processes in an emergency department: Insights from a computer simulation study. Operations Research for Health Care, 2(4), 66–74. https://doi.org/10.1016/j.orhc.2013.04.001

Li, N., Li, X., & Forero, P. (2021). Physician scheduling for outpatient department with nonhomogeneous patient arrival and priority queue. Flexible Services and Manufacturing Journal, 34(4), 879–915. https://doi.org/10.1007/s10696-021-09414-x

Luo, L., Li, J., Xu, X., Shen, W., & Xiao, L. (2019). A data-driven hybrid three-stage framework for hospital bed allocation: A case study in a large tertiary hospital in China. Computational and Mathematical Methods in Medicine, 2019, Article 7370231. https://doi.org/10.1155/2019/7370231

Manktelow, M., Iftikhar, A., Bucholc, M., McCann, M., & O'Kane, M. (2022). Clinical and operational insights from data-driven care pathway mapping: A systematic review. BMC Medical Informatics and Decision Making, 22(1), Article 42. https://doi.org/10.1186/s12911-022-01756-2

Nasir, M., Summerfield, N., Dag, A., & Oztekin, A. (2020). A service analytic approach to studying patient no-shows. Service Business, 14(2), 287–313. https://doi.org/10.1007/s11628-020-00415-8

Ortíz-Barrios, M. A., & Alfaro-Saíz, J. (2020). Methodological approaches to support process improvement in emergency departments: A systematic review. International Journal of Environmental Research and Public Health, 17(8), Article 2664. https://doi.org/10.3390/ijerph17082664

Rad, R. H., Baniasadi, S., Yousefi, P., Heravi, H. M., Al-Ani, M. S., & Ilani, M. A. (2022). Presented a framework of computational modeling to identify the patient admission scheduling problem in the healthcare system. Journal of Healthcare Engineering, 2022, 1–15. https://doi.org/10.1155/2022/1938719

Su, Q., Yao, X., Su, P., Shi, J., Zhu, Y., & Xue, L. (2010). Hospital registration process reengineering using simulation method. Journal of Healthcare Engineering, 1(1), 67–82. https://doi.org/10.1260/2040-2295.1.1.67

Tao, L., & Liu, J. (2019). An intelligent healthcare decision support system. In Health information science (pp. 131–154). Springer. https://doi.org/10.1007/978-3-030-15385-4_8

Tavakoli, M., Tavakkoli-Moghaddam, R., Mesbahi, R., Ghanavati-Nejad, M., & Tajally, A. (2022). Simulation of the COVID-19 patient flow and investigation of the future patient arrival using a time-series prediction model: A real-case study. Medical & Biological Engineering & Computing, 60(4), 969–990. https://doi.org/10.1007/s11517-022-02525-z

Uslu, B. Ç., Okay, E., & Dursun, E. (2020). Analysis of factors affecting IoT-based smart hospital design. Journal of Cloud Computing: Advances, Systems and Applications, 9(1), Article 67. https://doi.org/10.1186/s13677-020-00215-5

Van Hulzen, G., Martin, N., & Depaire, B. (2021). The need for interactive data-driven process simulation in healthcare: A case study. In Lecture notes in business information processing (pp. 317–329). Springer. https://doi.org/10.1007/978-3-030-72693-5_24

Wang, L., & Alexander, C. A. (2020). Big data analytics in medical engineering and healthcare: Methods, advances and challenges. Journal of Medical Engineering & Technology, 44(6), 267–283. https://doi.org/10.1080/03091902.2020.1769758

Wang, Z., & Liu, R. (2021). Managing appointments of outpatients considering the presence of emergency patients: The combination of the analytical and data-driven approach. International Journal of Production Research, 60(13), 4214–4228. https://doi.org/10.1080/00207543.2021.2007425

Wartelle, A., Mourad-Chehade, F., Yalaoui, F., Laplanche, D., & Sanchez, S. (2022). Forecasting saturation in the emergency department: A comparison of queuing data-driven approaches. IFAC-PapersOnLine, 55(10), 1556–1561. https://doi.org/10.1016/j.ifacol.2022.09.612

Xu, Y., Shang, X., Zhao, H., Zhang, R., & Wang, J. (2018). The characteristics of service efficiency and patient flow in heavy load outpatient service system. In Communications in computer and information science (pp. 17–30). Springer. https://doi.org/10.1007/978-981-13-3149-7_2

Zhai, Y., Li, R., & Yan, Z. (2022). Research on application of meticulous nursing scheduling management based on data-driven intelligent optimization technology. Computational Intelligence and Neuroscience, 2022, Article 3293806. https://doi.org/10.1155/2022/3293806

Zhang, Y., Luo, L., Yang, J., Liu, D., Kong, R., & Feng, Y. (2018). A hybrid ARIMA-SVR approach for forecasting emergency patient flow. Journal of Ambient Intelligence and Humanized Computing, 10(8), 3315–3323. https://doi.org/10.1007/s12652-018-1059-x

Zhong, X., Lee, H. K., & Li, J. (2017). From production systems to health care delivery systems: A retrospective look on similarities, difficulties and opportunities. International Journal of Production Research, 55(14), 4212–4227. https://doi.org/10.1080/00207543.2016.1277276


Article metrics
View details
0
Downloads
0
Citations
36
Views
📖 Cite article

View Dimensions


View Plumx


View Altmetric


0
Save
0
Citation
36
View
0
Share