Data Modeling

Mathematical and Computational Data Modeling
1
Citations
6k
Views
37
Articles
Your new experience awaits. Try the new design now and help us make it even better
Switch to the new experience
Figures and Tables
RESEARCH ARTICLE   (Open Access)

Financial News Sentiment and Stock Price Movement: An LSTM-Based Machine Learning Approach

Iffat Jahan 1*

+ Author Affiliations

Data Modeling 3 (1) 1-8 https://doi.org/10.25163/data.3110810

Submitted: 28 September 2022 Revised: 14 December 2022  Published: 20 December 2022 


Abstract

Whether the emotional tone of financial news genuinely anticipates price movement, or only appears to once the outcome is already known, is a question that has resisted a tidy answer for years — and this study revisits it empirically rather than assuming either side. Background: unstructured signals such as financial headlines are widely believed to carry information that historical prices alone cannot capture, yet the evidence remains mixed across markets and modelling choices. Methods: using a labelled corpus of more than 200,000 financial news headlines and seven years of company-level closing-price data for Apple Inc. (AAPL), we built a two-stage pipeline — a Naive Bayes and Support Vector Machine sentiment classifier, followed by a Long Short-Term Memory (LSTM) network that forecasts next-day price movement from both sentiment and price history. A closing-price-only LSTM served as the comparison baseline. Results: the sentiment classifier reached approximately 75% accuracy, and the sentiment-augmented LSTM outperformed the price-only variant, particularly during recovery phases of the test window. Correlational analysis further showed sentiment and price moving in the same direction on most observed trading days. Conclusion: financial news sentiment appears to carry real, if still modest, predictive value beyond price history alone, and improving sentiment-classification accuracy is likely the most direct route toward sharper forecasts. The findings, while limited to a single company and a comparatively small news corpus, are broadly consistent with prior work from other exchanges and modelling frameworks.

Keywords: financial news sentiment; stock price prediction; Long Short-Term Memory (LSTM); Naive Bayes; Support Vector Machine; time-series forecasting

1. Introduction

The stock market occupies a peculiar position in modern economies — indispensable to how capital moves, yet stubbornly resistant to any clean explanation of why it moves the way it does. It rewards patient investors and punishes careless ones, sometimes within the same week, and for decades researchers have tried to pin down what actually drives prices up or down. Historical price data alone, it turns out, only tells part of that story. Something appears to be missing when models rely solely on numbers pulled from past trading sessions, and that something seems to live, at least in part, in language — in the headlines, commentary, and opinion pieces that surround a company long before its share price actually shifts.

This paper begins from a fairly modest, almost commonsense premise: news carries emotional weight, and that weight might carry predictive information. Positive coverage of a company plausibly nudges investor confidence upward; negative coverage tends to do the reverse. Whether this intuition survives contact with real data, though, is a separate matter entirely — one this study tries to answer empirically rather than take on faith.

The literature offers encouragement, if not certainty. Sentiment analysis applied to financial text has repeatedly been shown to add value beyond price history alone. Transformer-based classifiers such as FinBERT, for instance, have outperformed more traditional approaches including Naive Bayes and BERT on financial sentiment tasks (Syeda, 2022), while Naive Bayes paired with Support Vector Machines has separately demonstrated respectable accuracy on related classification problems (Pavitha et al., 2022). Lexicon-based methods offer a lighter-weight alternative to these supervised approaches — Akter and Aziz (2016) applied one to Facebook group data with reasonable success, and Bonta et al. (2019), surveying the broader lexicon-based literature, concluded that such methods trade away some accuracy in exchange for not requiring labelled training data. None of this is trivial to get right, either; Arif et al. (2018) found that short, informal text of the kind common in headlines complicates sentiment and spam detection alike, a caution worth keeping close at hand given that headlines are exactly what this study relies on.

Beyond sentiment classification itself, a separate strand of work has asked whether sentiment, once extracted, actually improves forecasting outcomes. Mohan et al. (2019) combined five years of S&P 500 closing prices with contemporaneous news articles and found that recurrent neural networks outperformed both ARIMA and Facebook Prophet — though, tellingly, their models faltered when prices were low or unusually volatile. Li et al. (2020), working with Hong Kong Exchange data, reported that LSTM architectures outperformed multiple kernel learning and SVM approaches, and that sentiment features measurably improved prediction accuracy. Li, Xie, Chen, Wang, and Deng (2014) add an important qualification: sentiment-aware models beat simple bag-of-words baselines at the stock, sector, and index levels, but polarity alone — positive versus negative — was not sufficient for consistently strong predictions. Shynkevich et al. (2015) approached the problem from a different angle, showing that combining several categories of news, rather than treating headlines as one undifferentiated stream, improved forecasting performance further still.

The picture widens once social media enters the frame. Batra and Daudpota (2018) integrated StockTwits sentiment with price prediction and reported measurable gains, and Derakhshan and Beigy (2019) found something similar using stock-focused social platforms. The pattern is not confined to financial markets, either — Chauhan et al. (2021) observed that sentiment extracted from public text improved election forecasting, hinting that whatever signal sentiment carries may generalise across rather different prediction problems. Biswas et al. (2020) and Eck et al. (2021) extended this line of inquiry to economically turbulent conditions and to broader market-performance classification, respectively, reinforcing that the news-to-price relationship seems to hold up across a range of framings.

More recent work has leaned further into LSTM-based forecasting, occasionally under unusual circumstances. Chou et al. (2021) and Budiharto (2021) both applied sentiment-augmented LSTM models during the COVID-19 period and found the approach held up reasonably well despite the disruption to ordinary market behaviour. Dutta et al. (2021) pursued a hybrid deep-learning architecture rather than relying on LSTM alone, and Elena (2021) used XGBoost together with sentiment features to forecast the OMXS30 index — a reminder that LSTM, however popular, is one modelling choice among several viable options. Underlying much of this work is the basic statistical character of price series themselves; Chaudhuri et al. (2018) examined their fractality and non-stationarity, findings that help explain why architectures explicitly built for complex temporal dependencies, such as LSTM, have become a natural fit for this kind of forecasting task.

Taken together, the literature suggests that sentiment matters, but it rarely offers a clean or complete account of how much it matters, or under which conditions. This study attempts to add one modest data point to that ongoing conversation: a two-stage pipeline that first classifies financial news sentiment and then folds that signal into an LSTM forecasting model, evaluated against a price-only baseline using seven years of company-level price data alongside a purpose-built target-company news corpus. What follows is an account of how that pipeline was built, what it found, and — just as importantly — where it still falls short.

2. Methodology

2.1 Study Design and Analytical Framework

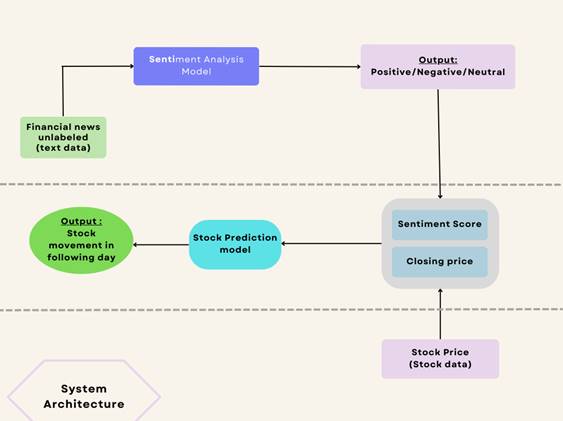
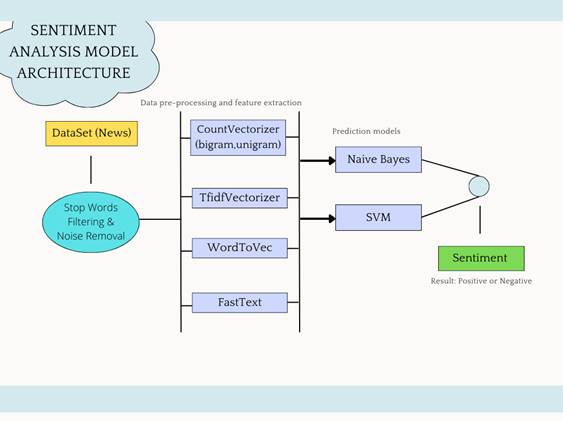
This study was structured as a two-stage predictive modelling task rather than a single end-to-end pipeline, and that distinction shapes how the rest of this section is organised. The first stage is concerned purely with language — classifying the emotional valence of financial news text. The second stage is concerned with time — forecasting next-day stock price movement using both historical price and the sentiment signal produced in the first stage. The two stages were kept deliberately separable and independently evaluable, partly so that errors could be diagnosed at their source (a weak sentiment classifier and a weak time-series model produce very different failure signatures), and partly because this mirrors how much of the prior literature has framed the problem (Li et al., 2014; Li et al., 2020; Mohan et al., 2019). Figure 1 summarises the overall architecture; the subsections below proceed in the order data actually moved through the system — acquisition, preprocessing, feature construction, model training, and evaluation — so that, in principle, another researcher could follow the same sequence and reproduce the pipeline from raw inputs.

2.2 Data Sources and Acquisition

Sentiment training corpus. No sentiment-labelled dataset existed for the target company’s own news coverage, so a separate, independently labelled corpus was first required to train a general-purpose financial sentiment classifier. The India Financial News Headlines Sentiments dataset was retrieved from Kaggle (https://www.kaggle.com/datasets/harshrkh/india-financial-news-headlines-sentiments). This corpus was selected for two practical reasons: scale and provenance. It comprises more than 200,000 financial news headlines spanning 2017 through 2021, each pre-labelled by sentiment polarity — sufficient volume to train a supervised classifier without immediately running into the data-scarcity problems that are common in financial natural-language-processing (NLP) work, where labelled, domain-specific corpora tend to be small. Three fields were retained from the full dataset: sentiment label, headline title, and publication date. After filtering to the positive and negative classes used for binary classification, the working corpus comprised 92,383 positive headlines and 108,118 negative headlines (Figure 2) — a class distribution that, while not perfectly balanced, was close enough that no additional resampling was applied. [Authors should specify here the exact inclusion/exclusion criteria applied when filtering the raw Kaggle file — e.g., handling of duplicate headlines, non-English text, or missing dates — to allow independent reconstruction of the working corpus.]

Target-company news corpus. A sentiment classifier trained on a general corpus is only useful if it can be applied to news about the specific company being forecast, and that corpus had to be constructed separately. A custom web scraper was built to collect news headlines from a recognised financial news portal, with collection restricted to outlets carrying an established editorial track record, in order to limit the risk of incorporating fabricated or low-credibility “fake news” into the sentiment pipeline. This process yielded a corpus of more than 500 news items pertaining to the target company.

Historical stock price data. Daily historical price data for the target company were obtained from a publicly available Kaggle repository covering Apple Inc. (ticker: AAPL), spanning a seven-year period. Apple was selected as the initial test case partly for reasons of data availability and partly because a heavily traded, news-saturated stock offers a reasonably stringent test of whether sentiment signal can be extracted at all — if a signal is not detectable here, it seems unlikely to be more detectable in a thinner-coverage stock. The raw download included open, high, low, close, and volume fields; following standard practice in comparable forecasting work (Mohan et al., 2019), only the daily closing price was retained as the price-based feature for downstream modelling, since closing price is the figure most consistently used across the literature for end-of-day movement prediction and avoids the added noise introduced by intraday fluctuation.

2.3 Data Preprocessing

Text preprocessing. Before any classifier could be trained, the raw headline text needed to be normalised — an unglamorous step, admittedly, but one that disproportionately affects downstream accuracy in our experience. Two operations were applied to every headline in both the training corpus and the target-company corpus: conversion of all text to lowercase, which reduces token sparsity that would otherwise arise

Table 1. Feature Description. These four features—closing price, compound sentiment, and the positive, negative, and neutral confidence scores—constitute the input feature set for the Long Short-Term Memory (LSTM) stock prediction model described in the Methods section. Sentiment-derived features were generated by aggregating day-level outputs of the Naive Bayes and Support Vector Machine classifiers across all news items published on a given trading day.

Feature

Meaning

Price

The closing price of a company

Compound

Polarity of news sentiment

Positive

Confidence of positive news

Negative

Confidence of negative news

Neutral

Confidence of neutral news

Figure 1. Architecture of the Proposed Stock Movement Prediction System. Schematic overview of the end-to-end system pipeline. Unlabeled financial news text is first passed through the sentiment analysis model, which outputs a categorical sentiment label (positive, negative, or neutral) for each news item. These outputs, together with daily closing price data obtained independently from stock market records, are combined into a unified feature set comprising sentiment score and closing price. This combined feature set is then supplied to the stock prediction model, which outputs a forecast of stock price movement for the following trading day. Dashed horizontal lines demarcate the three functional stages of the pipeline: text-based sentiment inference, feature integration, and price-movement forecasting.
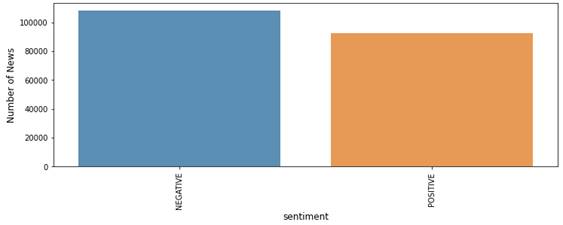
Figure 2. Class Distribution of the Sentiment-Labeled News Headline Corpus. Bar chart showing the number of headlines per sentiment class in the labeled training corpus (India Financial News Headlines Sentiments dataset; n = 200,501) used to train the sentiment classification models. The negative class comprised 108,118 headlines and the positive class comprised 92,383 headlines, reflecting a modest class imbalance that was not corrected with additional resampling prior to model training.

from inconsistent capitalisation (e.g., treating “Stock” and “stock” as distinct tokens), and removal of common English stop words, using the standard stop-word list from the Scikit-learn library (Géron, 2022), which allows the classifier to concentrate its discriminative capacity on lexically meaningful terms rather than high-frequency function words carrying little sentiment information.

Feature engineering for stock prediction. Following sentiment classification, each headline in the target-company corpus was assigned a predicted sentiment label, and these labels were aggregated to the daily level: for every trading day, the number of positive, neutral, and negative news items published was counted. This daily aggregation step was necessary because the price-prediction model operates on a daily time step, while raw news data arrives at an irregular, sub-daily frequency; aggregating counts per day is what allowed the two data streams to be aligned into a single, coherent feature table. The resulting integrated dataset comprised four features per trading day (Table 1): closing price, compound sentiment polarity, and confidence scores for positive, negative, and neutral classifications.

2.4 Feature Extraction for Text Representation

Raw text cannot be supplied directly to a machine-learning classifier, so a numerical representation step was required to bridge unstructured language and the vector-based input that supervised models expect. Three families of text-vectorisation approach were considered. Term frequency–inverse document frequency (TF-IDF) weighting was used as one candidate representation; this statistic captures how important a given word is to a document, on the intuition that a term’s weight should rise with its frequency within a document but be discounted if it appears ubiquitously across the corpus (Su et al., 2011). The CountVectorizer implementation from Scikit-learn (Géron, 2022) was also used, converting text into a numerical vector based on simple token-frequency counts and providing a straightforward bag-of-words baseline against which the TF-IDF representation could be compared. Embedding-based approaches — specifically Word2Vec and FastText — were considered as well; both pursue dense vector representations of words, but FastText extends Word2Vec by incorporating subword (n-gram) information, which lengthens training time owing to the larger number of n-gram units relative to whole words, but in exchange handles rare or out-of-vocabulary terms more gracefully — a property particularly relevant to financial headline text, where novel company names, ticker symbols, and industry-specific terminology routinely fall outside a fixed vocabulary.

2.5 Sentiment Classification Models

Two supervised classifiers — Naive Bayes and Support Vector Machine — were trained following vectorisation, selected because both have demonstrated reasonable performance on short-text sentiment-classification tasks in prior financial NLP work (Pavitha et al., 2022), while remaining computationally lightweight relative to transformer-based alternatives. Figure 3 presents the architecture of this component.

The Multinomial Naive Bayes variant was implemented, this being the form most commonly applied in NLP tasks; it rests on Bayes’ theorem, which estimates the probability of an event conditional on prior knowledge and evidence:

P(A|B) = [P(A) × P(B|A)] / P(B)

where P(A) denotes the prior probability of class A, P(A|B) denotes the posterior probability of class A given evidence B, and P(B|A) denotes the likelihood of observing evidence B given class A. The Multinomial variant operates on term frequencies — counts of how often a given word occurs within a document — normalised by document length and used to compute maximum-likelihood estimates of the conditional probabilities from the training data (Su et al., 2011).

A Support Vector Machine (SVM) classifier was also implemented, one of the most widely adopted supervised algorithms for textual polarity detection. SVM performs classification by seeking the hyperplane that optimally separates classes once the data are projected into an n-dimensional feature space; where the data are not linearly separable in their original space, kernel functions (linear, sigmoid, radial basis function, polynomial, or other non-linear variants) can be used to transform the feature space to permit separation. A linear kernel was used here, on the grounds that text-classification tasks typically involve a very high-dimensional feature space (each distinct word or token effectively constitutes its own feature), and linearly separable structure tends to emerge naturally at that dimensionality; a linear kernel also trains substantially faster than non-linear alternatives and tends to perform well whenever a reasonably clear margin separates the classes.

2.6 Stock Price Movement Prediction Model

Rationale for model selection. A Long Short-Term Memory (LSTM) recurrent neural network architecture was selected for the price-forecasting component. LSTM networks have become a common choice for stock-market prediction tasks because of their explicit design for capturing long-range temporal dependencies in sequential data (Li et al., 2020) — a property directly relevant here, since closing-price data is itself a time series, and simpler feedforward or shallow-memory architectures tend to lose access to longer-horizon patterns that may carry predictive value.

Data partitioning. The combined dataset — closing price plus daily-aggregated sentiment features — was partitioned chronologically into a training set comprising the first 80% of observations and a held-out test set comprising the remaining 20%. A random train/test split was deliberately avoided, since shuffling time-series data would allow the model to be evaluated on dates that precede some of its own training examples, producing an artificially optimistic and practically meaningless estimate of forecasting performance. The chronological split instead ensures that the test set strictly represents future time periods relative to training, which is the only evaluation configuration that meaningfully approximates real-world deployment.

Input normalisation and windowing. Prior to training, all input features were normalised to the [0, 1] interval. This step matters for two reasons: it prevents features with larger raw numeric ranges — closing price, which can run into the hundreds of dollars — from dominating the learning process relative to smaller-scale sentiment confidence scores, and it generally improves the numerical stability and convergence behaviour of gradient-based optimisation. Because LSTM networks operate on sequences rather than single time points, fixed-length input windows were constructed from the normalised time series, where each window comprises a contiguous span of historical daily observations and the associated target is the subsequent day’s stock movement. A window length of 14 trading days (roughly three calendar weeks) was used; this reflects a practical compromise, since a window too short risks omitting genuinely predictive longer-term patterns, while a window too long increases the model’s parameter burden relative to the size of the available training data. This parameter was not exhaustively tuned and represents an area for refinement in future work.

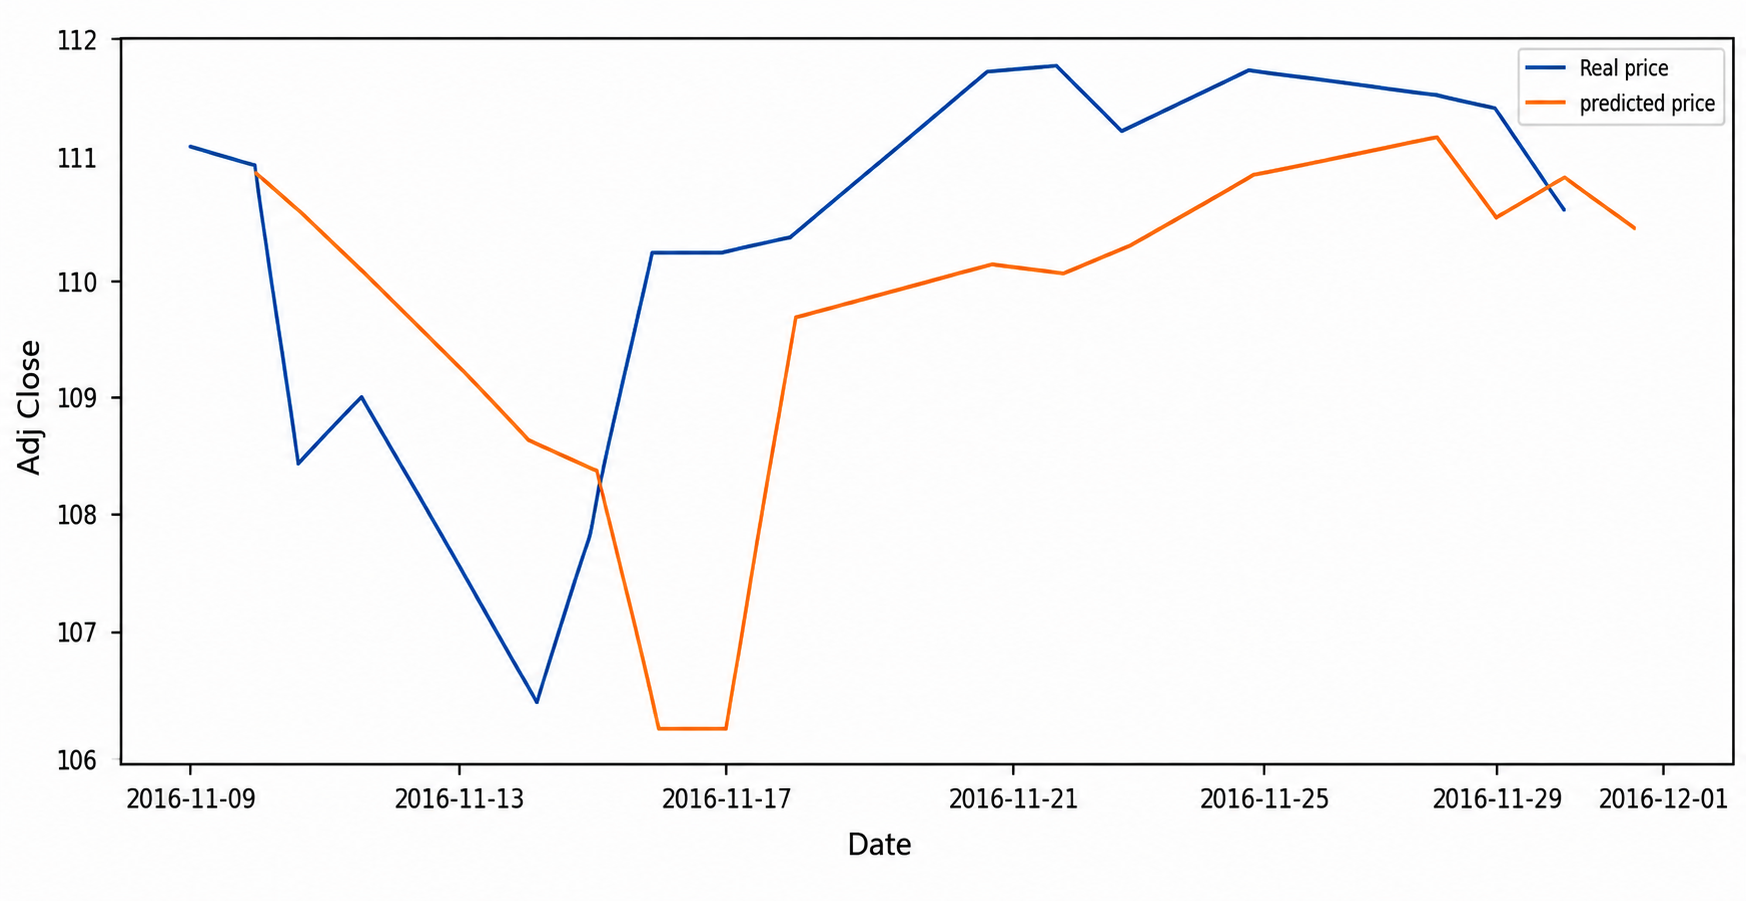
Model architecture and training procedure. The LSTM network was trained on the windowed training data, learning to map each 14-day input sequence to its corresponding target value. Model parameters were updated iteratively via gradient-based optimisation to minimise prediction error between model output and true target, using mean squared error as the loss function and the Adam optimiser for parameter updates — a pairing that is fairly standard for regression-style sequence-prediction tasks of this kind, owing to Adam’s adaptive learning-rate behaviour, which tends to produce more stable convergence than plain stochastic gradient descent, particularly when feature scales or gradient magnitudes vary across training. Two variants of this model were trained and compared: one using only the normalised closing price as input (Figure 5), and a second incorporating both closing price and the daily-aggregated sentiment features described above (Figure 6). This comparison constituted the central manipulation of the study, isolating whatever incremental contribution sentiment information makes over price history alone.

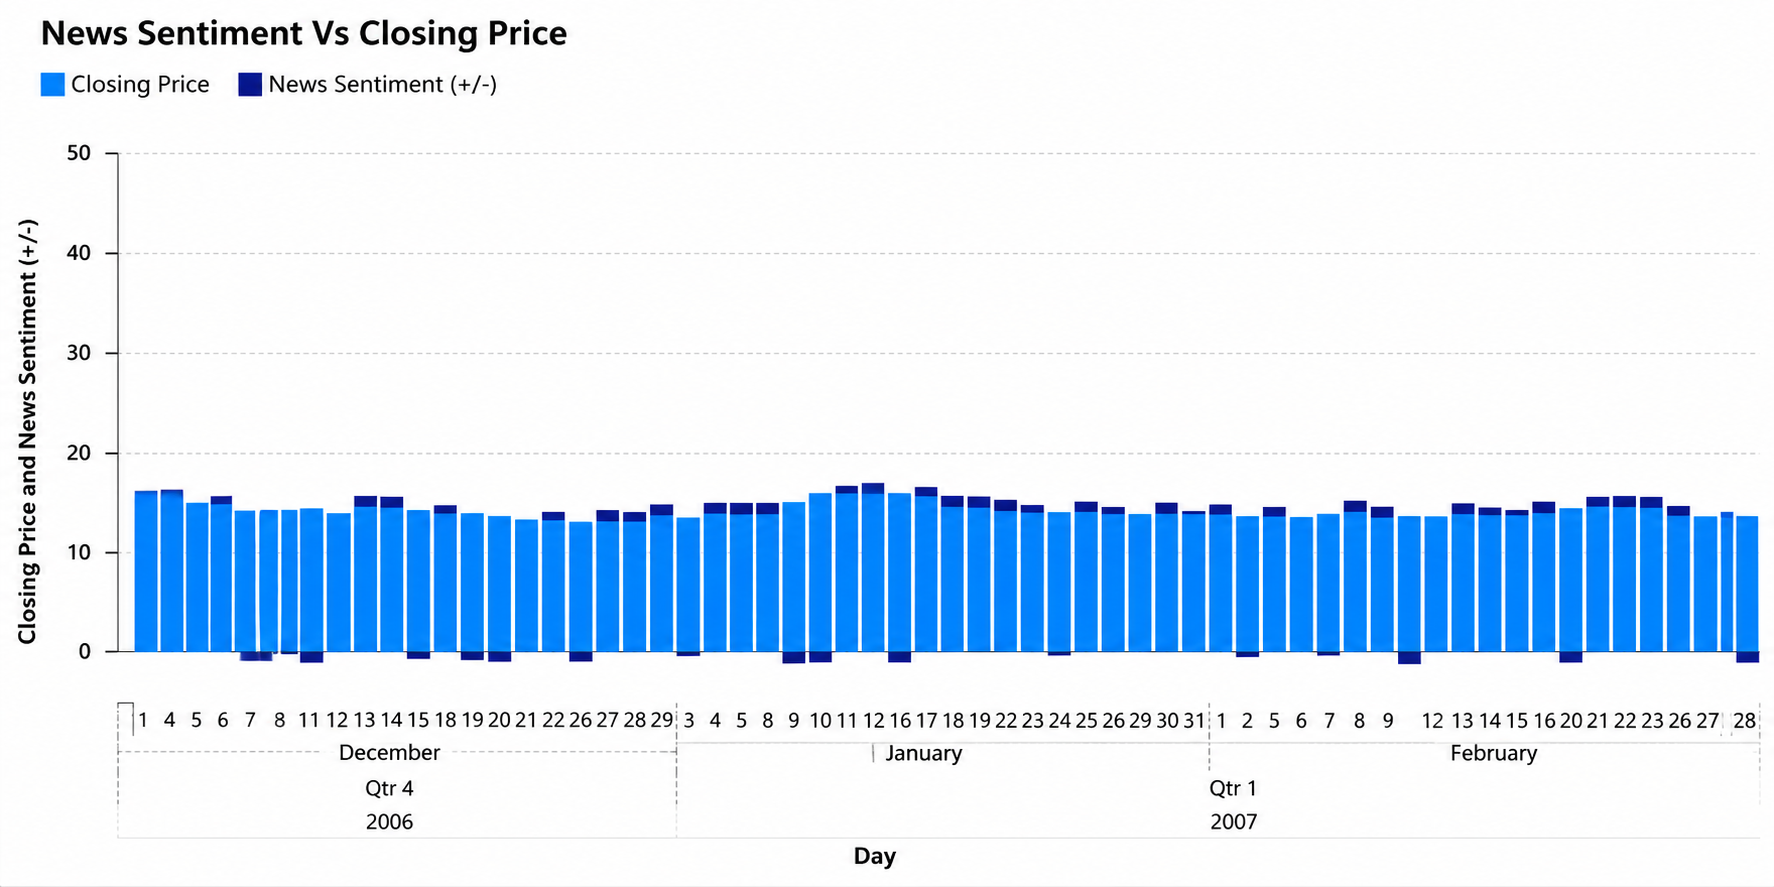
2.7 Model Evaluation

Each trained LSTM variant was applied to the held-out test set to generate predictions on previously unseen data, and predicted closing prices were compared against actual observed prices across the test period. The correlation between daily news-sentiment polarity and same-day closing-price movement (Figure 4) was additionally examined as a complementary, model-independent check on whether the underlying sentiment–price relationship the system depends on was actually present in the data, rather than relying solely on downstream forecasting accuracy to make that case indirectly. Because the sentiment classifier’s own accuracy directly bounds how much useful signal can flow into the price model, classifier-level performance (Naive Bayes and SVM accuracy) is reported separately from downstream LSTM forecasting results, so that errors attributable to language classification can be distinguished from those attributable to time-series modelling rather than being conflated into a single end-to-end metric.

3. Results

3.1 Overview

Before turning to the numbers, it is worth restating plainly what this section sets out to establish: does financial news sentiment carry information that helps predict stock-price movement, beyond what historical price alone can offer? The results below proceed in stages — first examining whether sentiment and price move together in the data at all, then evaluating how well the sentiment classifier itself performed, and finally comparing the two LSTM forecasting variants against one another.

3.2 Relationship Between News Sentiment and Closing Price

The analysis began with a deliberately simple step: observing how sentiment and price moved together over time, without yet involving any predictive model. Correlational checks of this kind, however unglamorous next to a neural network, tend to be a useful sanity check before investing further effort in more complex architectures, and that is largely the role this step played here. Figure 4 plots the relationship between daily news sentiment and the closing price of the target stock. The pattern that emerged, while not perfectly consistent across every single trading day, held up often enough to be notable — on most days where news sentiment skewed positive, share price also tended to climb, pointing toward a positive association between the sentiment signal extracted from headlines and same-day or near-term price movement (Figure 4). Some caution is warranted around the word “causal” here, since this was a correlational observation rather than a controlled experiment; even so, the direction of the relationship is consistent with what earlier work on this topic has reported (Li et al., 2014; Li et al., 2020).

3.3 Performance of the Sentiment Classification Model

The next question was how reliable the sentiment labels feeding into the price model actually were, since a shaky classifier would leave everything downstream inheriting its uncertainty. The sentiment model, trained using the procedures described in Section 2, reached an accuracy of approximately 75%. That figure is a genuinely mixed result: high enough to suggest the model is capturing real signal rather than guessing at random, yet not so high that it can be considered a finished product — and because sentiment-classification accuracy effectively sets a ceiling on how well the downstream price model can perform, this shortfall is not a trivial one. Prior studies in this space have generally found transformer-based models such as FinBERT to outperform more traditional classifiers like Naive Bayes (Syeda, 2022); partly motivated by that gap in the literature, FinBERT was also explored in an effort to push sentiment-classification accuracy higher, though this remains an avenue for further development rather than a completed comparison. The class-distribution characteristics of the underlying training data are shown in Figure 2, and the overall sentiment-pipeline architecture is summarised in Figure 3.

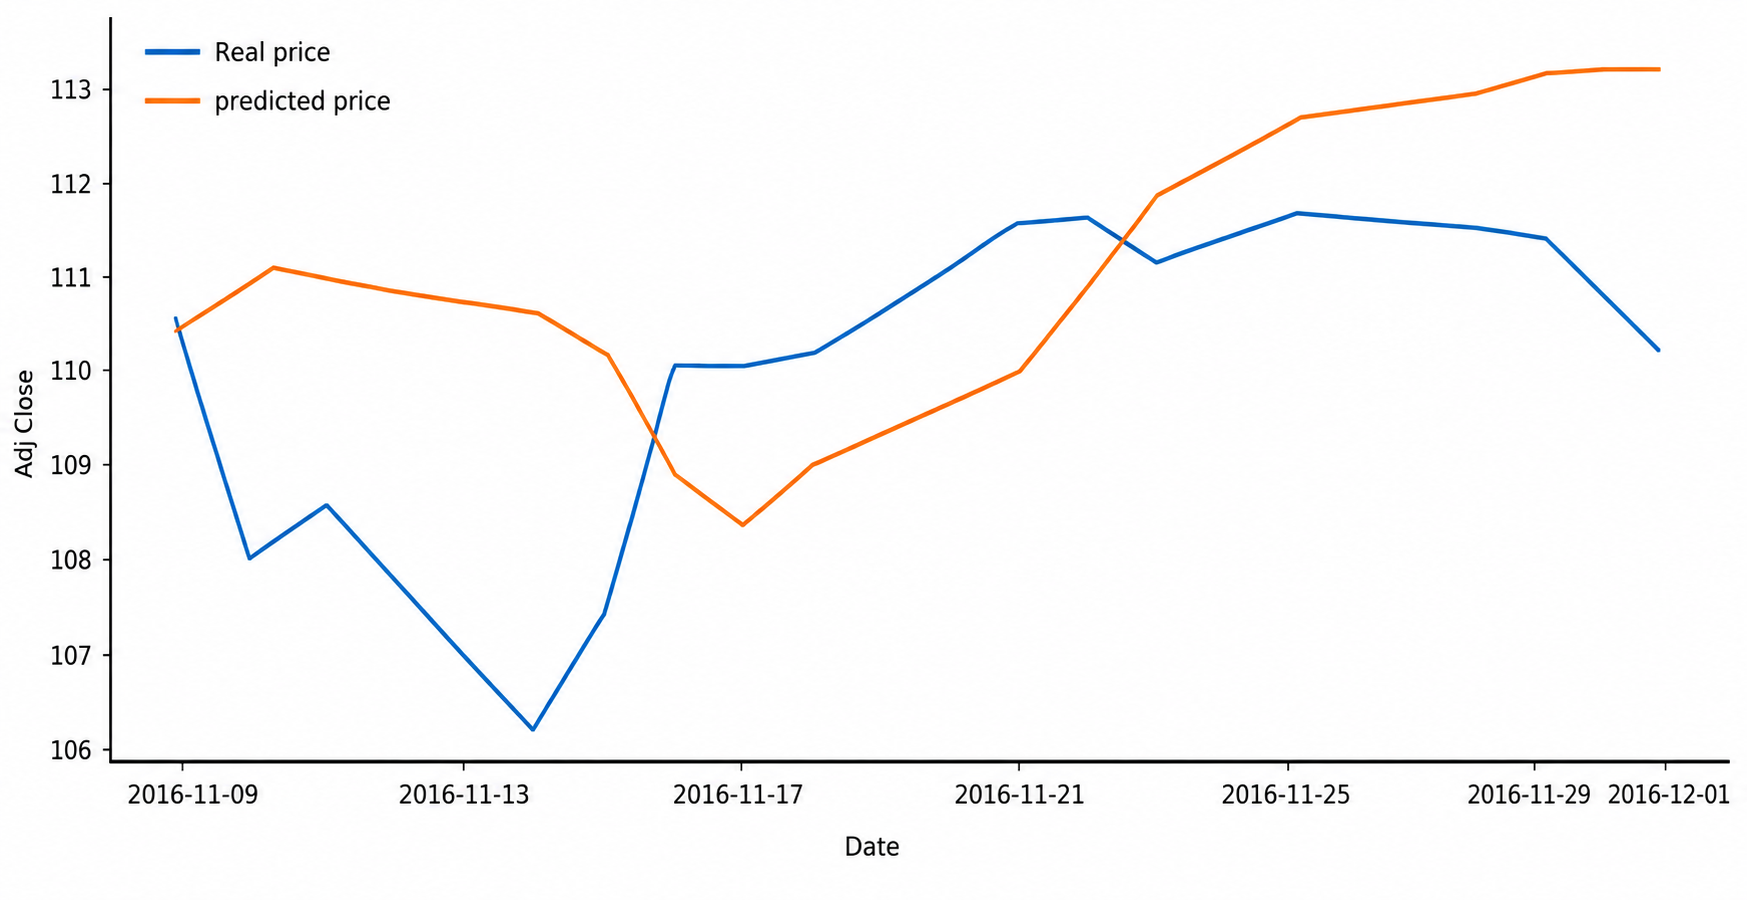
3.4 Stock Price Prediction Using Closing Price Alone

To isolate what sentiment was actually contributing — rather than simply assuming it helped — an LSTM model was first trained using only historical closing price as input, with the 14-day window described in Section 2. Figure 5 shows how this model’s predicted prices compared against the real, observed prices across the test period. The fit was, to put it plainly, underwhelming: the predicted trajectory captured some of the broad movement but consistently lagged behind or smoothed over sharper price swings, and the resulting accuracy was noticeably lower than what was obtained once sentiment was reintroduced (described next). This is not entirely surprising in hindsight — closing price alone represents only one slice of the information that moves markets day to day, and it captures nothing of the news, sentiment, or external events that often precede a price shift rather than merely follow it.

3.5 Stock Price Prediction Combining Closing Price and News Sentiment

A second LSTM variant was then trained, identical in architecture and training procedure to the first, except that it incorporated the daily-aggregated sentiment features (compound polarity, and positive, negative, and neutral confidence scores) alongside closing price. The results, shown in Figure 6, told a noticeably more encouraging story: this combined model achieved higher predictive accuracy than the price-only version, and for a number of dates within the test window, the predicted price tracked the actual price quite closely. It would be an overstatement, though, to describe this as a clean win across the board — there remained stretches where the model’s predictions diverged from reality, sometimes by a fair margin, and that should not be glossed over in the interest of a tidier narrative. Taken as a whole, however, the comparison between Figures 5 and 6 offers reasonably direct evidence that financial news sentiment adds predictive value on top of price history alone, consistent with related work using different markets and modelling approaches (Li et al., 2020; Mohan et al., 2019; Shynkevich et al., 2015).

3.6 Model Stability and Training Behaviour

Figure 3. Architecture of the Financial News Sentiment Analysis Model. Flow diagram of the sentiment classification pipeline, from raw input to final sentiment output. Raw news headlines (DataSet [News]) are first processed through stop-word filtering and noise removal, after which four candidate text-vectorization approaches are shown: CountVectorizer (unigram and bigram), TF-IDF vectorizer, Word2Vec, and FastText. Vectorized representations were used to train two supervised classifiers, Naive Bayes and Support Vector Machine (SVM), whose outputs were combined to generate the final sentiment classification (positive or negative).

Figure 4. Relationship Between Daily News Sentiment and Stock Closing Price. Stacked bar chart comparing daily closing price (light blue) and net news sentiment polarity (dark blue) for the target stock across the study period (December 2006–February 2007). Each bar represents a single trading day; bar segments extending below the zero line indicate days on which net news sentiment was negative. Visual inspection shows closing price and news sentiment tracking in the same direction across most of the observed period, consistent with a positive association between the two variables.

Figure 5. LSTM-Predicted Versus Actual Closing Price Using Closing Price Alone. Line plot comparing actual adjusted closing price (Real price, blue) against price predicted by the Long Short-Term Memory (LSTM) model (Predicted price, orange) on the held-out test set (November 9–December 1, 2016), using closing price as the sole model input with a 14-day input window. The predicted series captures the general downward-then-upward trend over the test period but lags behind several short-term reversals in the actual price, most notably around November 13–17.

Figure 6. LSTM-Predicted Versus Actual Closing Price Using Closing Price and News Sentiment. Line plot comparing actual adjusted closing price (Real price, blue) against price predicted by the Long Short-Term Memory (LSTM) model (Predicted price, orange) on the same held-out test set (November 9–December 1, 2016) as Figure 5, using a combined feature set of closing price and daily-aggregated news sentiment (compound, positive, negative, and neutral scores) as model input. Relative to the closing-price-only model in Figure 5, the predicted price trajectory more closely follows the timing and direction of actual price changes, particularly during the recovery phase beginning November 17, though deviation from the actual price remains visible toward the end of the test window.

One recurring issue during training, worth reporting candidly rather than smoothing over, was the LSTM architecture’s tendency to overfit fairly easily. Early training runs produced models that performed well on training data but generalised poorly to the held-out test set — a familiar difficulty with recurrent architectures trained on comparatively limited financial time series. After several rounds of retuning, a more stable configuration was reached, one that produced predictions appreciably closer to actual prices than initial attempts, though it would be inaccurate to describe the current model as fully optimised. A meaningful gap remains between “stable enough to report” and “ready for practical trading use,” and the present model sits closer to the former.

3.7 Summary of Findings

Pulling the threads together: the data show a discernible positive relationship between financial news sentiment and stock closing-price movement (Figure 4); the sentiment classifier performs at a moderate, though not yet strong, level of accuracy (approximately 75%); and incorporating sentiment into the LSTM forecasting model meaningfully improves prediction quality relative to using closing price alone, even though neither model variant has yet reached a level of accuracy suitable for practical trading decisions (Figures 5 and 6). Taken together, these results offer reasonably consistent support for the study’s original premise — that news sentiment carries useful predictive signal for stock movement — while also making clear that meaningful work remains before that signal translates into reliably accurate forecasts.

4. Discussion

4.1 Interpreting the Core Finding

The starting premise of this work was fairly simple to state, if not simple to test: does the emotional tone of financial news carry information that helps anticipate where a stock price is headed, or is that relationship mostly noise dressed up as signal? Based on what was observed, the answer leans, cautiously, toward the former. The positive association between daily news sentiment and closing-price movement (Figure 4), paired with the improvement seen when sentiment features were folded into the LSTM forecasting model (Figures 5 and 6), points in a consistent direction — sentiment is not merely along for the ride; it appears to be doing some genuine predictive work. That said, this result should not be oversold. The improvement was real, but it was not dramatic, and the model still missed the mark on a fair number of test dates. Perhaps the more honest framing, then, is this: sentiment helps, but it is not a silver bullet, and anyone expecting near-perfect forecasts from this approach alone would likely be disappointed.

4.2 Situating the Results Within Prior Literature

It is worth pausing to ask how these findings sit alongside what others have already reported, since stock prediction using news sentiment is hardly an untouched research area. Mohan et al. (2019), working with five years of price data for S&P 500 companies alongside news articles gathered from international outlets, found that recurrent neural network approaches outperformed both ARIMA and Facebook Prophet, and — much like what was observed here — noted a correlation between textual sentiment and price direction. Interestingly, they also flagged a weakness that echoes the present experience: their models struggled more when prices were low or highly volatile, suggesting the sentiment–price relationship may not hold uniformly across all market conditions, a nuance the present single-company, fixed-period dataset was not well positioned to probe in depth.

Li et al. (2020) reported something a little more decisive in their work on the Hong Kong Exchange: LSTM outperformed both multiple kernel learning and SVM approaches, and incorporating sentiment improved accuracy beyond what price data alone could achieve. That pattern lines up closely with the present findings, which is reassuring in one sense — it suggests this result is not a one-off artefact of this particular dataset — though it also raises a slightly uncomfortable question about why overall accuracy here still falls short of what would be needed for practical deployment, despite a broadly similar architecture. Part of the answer probably lies in scale; their dataset spanned several years across an established exchange, whereas the present one was comparatively modest in both duration and company coverage.

Li et al. (2014) add a caveat that seems directly relevant here: sentiment-aware models did outperform simple bag-of-words approaches at the stock, sector, and index levels, but the authors were careful to note that relying purely on positive-versus-negative polarity is not enough to achieve consistently strong predictions. The present findings echo that caution reasonably well. The 75% accuracy ceiling on the sentiment classifier (Section 3.3) likely constrains how much further the downstream price model can improve, regardless of how the LSTM architecture itself is tuned — garbage in, garbage out, as the saying goes, though “garbage” feels like an unfairly harsh word for a 75%-accurate classifier. Shynkevich et al. (2015) took a related but distinct angle, showing that combining multiple categories of news — divided by sector and industry — improved forecasting performance relative to using a narrower slice of articles. That kind of categorical breadth was not explored here, and it is a reasonable possibility that doing so might have given the model more to work with than sentiment polarity alone.

4.3 Why the Sentiment Classifier’s Accuracy Matters So Much

It is tempting to treat the sentiment model and the price-forecasting model as two separate stories, but they are tightly coupled, and that coupling is probably the single biggest factor shaping the overall results. Existing work comparing classifier architectures has found that FinBERT tends to outperform both Naive Bayes and BERT-based classifiers on financial sentiment tasks (Syeda, 2022), which is part of why FinBERT was explored here once Naive Bayes and SVM plateaued around 75% accuracy. Pavitha et al. (2022) similarly found that Naive Bayes and SVM deliver reasonably solid results in sentiment classification more broadly — not state-of-the-art, perhaps, but serviceable — and the present results are roughly consistent with that characterisation: good enough to be useful, not yet good enough to be the final word. Whatever error the sentiment classifier carries forward gets baked into the daily sentiment-aggregation features described in Section 2, and from there propagates directly into the LSTM’s input space. When the price model underperforms on certain dates, it is genuinely difficult to say with confidence whether that reflects an LSTM limitation, a sentiment-labelling error, or some combination of the two — an ambiguity worth naming plainly rather than glossing over.

4.4 On Overfitting and Model Stability

One thing not fully anticipated at the outset, though perhaps it should have been, was how readily the LSTM architecture slipped into an overfit state during early training attempts. This is a fairly well-documented tendency of recurrent networks trained on time series that are comparatively short or noisy, and the dataset used here — seven years of single-company price data plus a modest news corpus — falls roughly into that category. After repeated retuning, a more stable configuration was reached, one that produced predictions noticeably closer to actual values, but it would not be honest to describe the model as fully optimised at this point. There is a meaningful gap between “stable enough to report” and “ready for practical trading use,” and the current model sits closer to the former.

4.5 Limitations

Several limitations deserve to be stated plainly, partly because transparency here matters more than presenting an overly polished narrative. First, the sentiment classifier’s accuracy — hovering around 75% — places a fairly hard ceiling on how much benefit the downstream price model can realistically extract from sentiment features, regardless of how the LSTM itself is configured. Second, the stock-price dataset, while spanning seven years, was drawn from a single company (Apple), which limits how confidently these findings can be generalised to other firms, sectors, or market conditions — particularly given that Mohan et al. (2019) found model performance itself varies with volatility and price level, a factor not directly examinable with a single-company dataset. Third, the target-company news corpus, at just over 500 items, is relatively small next to the scale of data used in some comparable studies (Li et al., 2020; Shynkevich et al., 2015), and a sparser news stream likely makes daily sentiment aggregation noisier than it would be with denser coverage. Finally, the LSTM’s tendency toward overfitting, even after tuning, suggests that the current model configuration may not yet be capturing the underlying price dynamics as robustly as would be ideal, and some of the prediction error reported in Section 3 may reflect that instability rather than a genuine ceiling on what sentiment-augmented forecasting can achieve.

4.6 Implications and Future Directions

Taken together, what this study contributes — modestly, but meaningfully — is further evidence that financial news sentiment is not predictively inert; it adds something over and above raw price history, even within a fairly constrained, single-company setup. The path forward seems reasonably clear. Improving the sentiment classifier itself, whether through FinBERT or another transformer-based approach, seems the most direct way to lift the ceiling described above, since the price model’s performance is so closely tethered to the quality of its sentiment inputs. Expanding the underlying dataset — more companies, longer time horizons, and a denser news corpus, perhaps incorporating multiple categories of articles in the spirit of Shynkevich et al. (2015) rather than treating all news as a single undifferentiated stream — would likely help address both the overfitting issue and the generalisability concerns raised above. There may also be value in incorporating additional features beyond price and sentiment alone, given that stock movement is shaped by a tangle of factors — macroeconomic indicators, trading volume, broader market indices — that this study did not attempt to capture. None of this is to say the current results are unimportant; rather, this work is better framed as one reasonably solid data point in a larger, ongoing effort to determine just how much of stock-market behaviour language can actually explain.

5. Conclusion

This study set out to test a fairly simple idea — that the emotional tone of financial news carries forecasting value beyond what historical prices alone can offer — and the evidence, on balance, supports it, if only cautiously. Sentiment classification reached moderate accuracy (~75%), and folding that sentiment into an LSTM forecasting model improved prediction quality over a closing-price-only baseline, even though neither model has yet reached deployment-grade reliability. The relationship uncovered here was real but imperfect, with residual error likely arising from both sentiment misclassification and LSTM instability rather than either factor alone. These findings extend, and largely agree with, prior evidence from other exchanges and modelling frameworks (Li et al., 2020; Mohan et al., 2019). Future work should prioritise stronger sentiment models — FinBERT or comparable transformer-based classifiers in particular — alongside broader company and news coverage and additional market features, in order to narrow the gap between a promising signal and a genuinely deployable forecasting tool.

Acknowledgements

The author I.J. wishes to thank the Department of Computer Science and Engineering, United International University, for providing the computational resources and academic environment in which this research was conducted. Gratitude is also extended to the maintainers of the publicly available Kaggle datasets used in this study, without which the sentiment-classification and price-forecasting components could not have been built.

Author Contribution

I.J.: Conceptualization, Methodology, Data curation, Software, Formal analysis, Investigation, Writing – original draft, Writing – review & editing, Visualization.

Competing Financial Interests

The author I.J.declares no competing financial interests or conflicts of interest related to this work.

References


Akter, S., & Aziz, M. T. (2016). Sentiment analysis on Facebook group using lexicon-based approach. In 2016 3rd International Conference on Electrical Engineering and Information Communication Technology (ICEEICT) (pp. 1–4). IEEE. https://doi.org/10.1109/ICEEICT.2016.7873080

Arif, M. H., Li, J., Iqbal, M., & Liu, K. (2018). Sentiment analysis and spam detection in short informal text using learning classifier systems. Soft Computing, 22(21), 7281–7291. https://doi.org/10.1007/s00500-017-2729-x

Batra, R., & Daudpota, S. M. (2018). Integrating StockTwits with sentiment analysis for better prediction of stock price movement. In 2018 International Conference on Computing, Mathematics and Engineering Technologies (ICoMET) (pp. 1–5). IEEE. https://doi.org/10.1109/ICOMET.2018.8346382

Biswas, S., Ghosh, A., Chakraborty, S., Roy, S., & Bose, R. (2020). Scope of sentiment analysis on news articles regarding stock market and GDP in struggling economic condition. International Journal of Emerging Trends in Engineering Research, 8(7), 3594–3609. https://doi.org/10.30534/ijeter/2020/117872020

Bonta, V., Kumaresh, N., & Janardhan, N. (2019). A comprehensive study on lexicon-based approaches for sentiment analysis. Asian Journal of Computer Science and Technology, 8(S2), 1–6.

Budiharto, W. (2021). Data science approach to stock prices forecasting in Indonesia during COVID-19 using Long Short-Term Memory (LSTM). Journal of Big Data, 8(1), Article 47. https://doi.org/10.1186/s40537-021-00430-0

Chaudhuri, A., Mukherjee, S., Chowdhury, S., & Sadhukhan, B. (2018). Fractality and stationarity analysis on stock market. In 2018 International Conference on Advances in Computing, Communication Control and Networking (ICACCCN) (pp. 395–398). IEEE. https://doi.org/10.1109/ICACCCN.2018.8748504

Chauhan, P., Sharma, N., & Sikka, G. (2021). The emergence of social media data and sentiment analysis in election prediction. Journal of Ambient Intelligence and Humanized Computing, 12(2), 2601–2627. https://doi.org/10.1007/s12652-020-02423-y

Chou, C., Park, J., & Chou, E. (2021). Predicting stock closing price after COVID-19 based on sentiment analysis and LSTM. In 2021 IEEE 5th Advanced Information Technology, Electronic and Automation Control Conference (IAEAC) (Vol. 5, pp. 2752–2756). IEEE. https://doi.org/10.1109/IAEAC50856.2021.9390845

Derakhshan, A., & Beigy, H. (2019). Sentiment analysis on stock social media for stock price movement prediction. Engineering Applications of Artificial Intelligence, 85, 569–578. https://doi.org/10.1016/j.engappai.2019.07.002

Dutta, A., Pooja, G., Jain, N., Panda, R. R., & Nagwani, N. K. (2021). A hybrid deep learning approach for stock price prediction. In A. Joshi, M. Khosravy, & N. Gupta (Eds.), Machine learning for predictive analysis (pp. 1–10). Springer. https://doi.org/10.1007/978-981-15-7106-0

Eck, M., Germani, J., Sharma, N., Seitz, J., & Ramdasi, P. P. (2021). Prediction of stock market performance based on financial news articles and their classification. In N. Sharma, A. Chakrabarti, V. E. Balas, & J. Martinovic (Eds.), Data management, analytics and innovation (pp. 35–44). Springer.

Elena, P. (2021). Predicting the movement direction of OMXS30 stock index using XGBoost and sentiment analysis [Bachelor’s thesis, Blekinge Institute of Technology]. http://urn.kb.se/resolve?urn=urn:nbn:se:bth-21119

Géron, A. (2022). Hands-on machine learning with Scikit-Learn, Keras, and TensorFlow. O’Reilly Media.

Li, X., Wu, P., & Wang, W. (2020). Incorporating stock prices and news sentiments for stock market prediction: A case of Hong Kong. Information Processing & Management, 57(5), Article 102212. https://doi.org/10.1016/j.ipm.2020.102212

Li, X., Xie, H., Chen, L., Wang, J., & Deng, X. (2014). News impact on stock price return via sentiment analysis. Knowledge-Based Systems, 69, 14–23. https://doi.org/10.1016/j.knosys.2014.04.022

Mohan, S., Mullapudi, S., Sammeta, S., Vijayvergia, P., & Anastasiu, D. C. (2019). Stock price prediction using news sentiment analysis. In 2019 IEEE Fifth International Conference on Big Data Computing Service and Applications (BigDataService) (pp. 205–208). IEEE. https://doi.org/10.1109/BigDataService.2019.00035

Pavitha, N., Pungliya, V., Raut, A., Bhonsle, R., Purohit, A., Patel, A., & Shashidhar, R. (2022). Movie recommendation and sentiment analysis using machine learning. Global Transitions Proceedings, 3(1), 279–284. https://doi.org/10.1016/j.gltp.2022.03.012

Shynkevich, Y., McGinnity, T. M., Coleman, S., & Belatreche, A. (2015). Predicting stock price movements based on different categories of news articles. In 2015 IEEE Symposium Series on Computational Intelligence (pp. 703–710). IEEE. https://doi.org/10.1109/SSCI.2015.107

Su, J., Shirab, J. S., & Matwin, S. (2011). Large scale text classification using semisupervised multinomial Naive Bayes. In Proceedings of the 28th International Conference on Machine Learning (ICML 2011).

Syeda, F. S. (2022). Sentiment analysis of financial news with supervised learning [Unpublished manuscript].


Article metrics
View details
0
Downloads
0
Citations
77
Views

View Dimensions


View Plumx


View Altmetric


0
Save
0
Citation
77
View
0
Share