2.1 Algorithm Design Rationale
The design of KMFusionNet proceeds from a relatively simple observation: nearly all existing boosting-based approaches to imbalanced classification — RUSBoost (Seiffert et al., 2010), SMOTEBoost (Chawla et al., 2003), EUSBoost (Galar et al., 2013), DataBoost (Guo & Viktor, 2004) — modify the data distribution around a fixed base learner rather than varying the learner itself. This is a reasonable approach, but it means that the diversity of the ensemble is driven entirely by reweighting, and the structural diversity that can arise from using different classifiers is left unexploited. De Souza and Matwin (2011) demonstrated that alternating among multiple estimators in AdaBoost can improve performance, but at substantial computational cost. KMFusionNet addresses this by restricting the alternating strategy to two lightweight, structurally diverse tree-based classifiers, yielding ensemble diversity without requiring computationally intensive models.
2.2 Base Classifiers
Two tree-based classifiers serve as the weak learners in KMFusionNet.
Decision Tree (C4.5). The C4.5 algorithm (Quinlan, 1996) constructs classification trees by selecting splits that maximize information gain, calculated using information entropy over the training set. Given training data S = {s₁, s₂, s₃, ...} where each instance sᵢ is represented by a feature vector X = {x₁,ᵢ, x₂,ᵢ, x₃,ᵢ, ...}, each node selects the feature that most effectively partitions instances into distinct class subsets. C4.5 trees are deterministic given the same training data, which means their structure is highly sensitive to perturbations introduced by AdaBoost's instance reweighting — a property that makes them well-suited to boosting.
Extra Tree Classifier. The Extra Tree classifier (Geurts et al., 2006) introduces additional randomization at the split-selection stage. Rather than searching exhaustively for the optimal split on each feature, the Extra Tree algorithm randomly generates a set of candidate split thresholds for a randomly selected subset of features, and selects the best among them. When the number of randomly selected features is set to one, the Extra Tree behaves similarly to a purely random tree. This additional stochasticity means that, even when trained on the same weighted dataset, Extra Tree and Decision Tree classifiers tend to partition the feature space differently, producing structurally diverse hypotheses — which is precisely what is needed to achieve boosting-level ensemble diversity (Figure 2).
2.3 Alternating Estimator Strategy
In standard AdaBoost (Freund et al., 1996), a single weak learner is applied at each iteration t = 1, 2, ..., T. In KMFusionNet, the learner alternates between the C4.5 Decision Tree and the Extra Tree classifier at successive iterations. Specifically, if t is odd the Decision Tree is used; if t is even the Extra Tree is used. Both classifiers are applied to the same reweighted training distribution Dₜ, as produced by the standard AdaBoost weight update mechanism.
After each iteration, the weak learner's error rate εₜ is computed on the weighted training set. A weak learner is retained only if εₜ < 0.5 — the standard AdaBoost weak classifier condition (Freund et al., 1996). If a learner fails this condition, it is discarded and the iteration counter is incremented without updating the ensemble weights. This automatic discard mechanism means that poorly performing learners are eliminated regardless of which estimator type they represent, preserving the integrity of the boosting update.
2.4 Early Stopping Criterion
To prevent the ensemble from growing unnecessarily large, KMFusionNet incorporates an early stopping criterion based on a stagnation window W (Bühlmann &
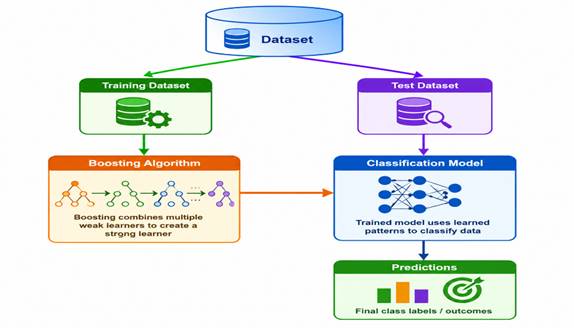
Figure 1. Schematic representation of the adaptive boosting framework for imbalanced data classification. The diagram illustrates the iterative weight-update mechanism underlying the KMFusionNet boosting architecture. At each iteration t, a weak learner is trained on the current weighted distribution of the training data D. Instances misclassified in the preceding round receive increased weights, while correctly classified instances are down-weighted, directing subsequent learners to focus progressively on difficult — predominantly minority class — samples. The final ensemble model H is constructed as a weighted majority vote across all retained weak learners, where learner weight α reflects individual classification accuracy. This adaptive reweighting process is the core mechanism by which boosting achieves improved minority class discrimination without explicit data resampling.
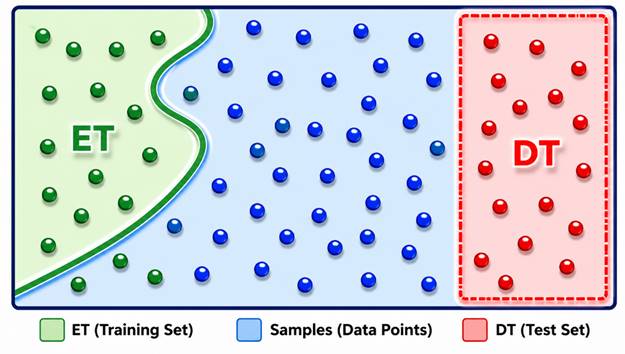
Figure 2. Conceptual illustration of complementary feature-space exploration by the Decision Tree (DT) and Extra Tree (ET) classifiers within the KMFusionNet boosting framework. The rectangle represents the complete training dataset D, in which each black dot corresponds to an individual instance. The region enclosed by the red boundary delineates the subspace explored by the C4.5 Decision Tree classifier, which partitions the feature space through deterministic, entropy-based greedy splitting. The green boundary illustrates the subspace explored by the Extra Tree classifier, which employs randomized threshold selection across randomly sampled features, producing structurally distinct decision boundaries on the same weighted training data. The partial overlap and complementary coverage of the two regions illustrate the hypothesis diversity that motivates the alternating estimator strategy in KMFusionNet: by combining learners that partition the feature space differently, the ensemble achieves broader and more robust decision boundary coverage, particularly in the underrepresented minority class regions.
Table 1. Characteristics of the 12 benchmark imbalanced datasets used for evaluation. All datasets were obtained from the KEEL dataset repository (Alcalá-Fdez et al., 2011). The imbalance ratio (IR) is defined as the ratio of majority class instances to minority class instances; higher values indicate more severe class skew. Datasets are ordered by ascending IR to facilitate comparison across mild (IR < 5), moderate (5 ≤ IR < 15), and severe (IR ≥ 15) imbalance conditions. The number of instances and features reflects the original dataset dimensions without preprocessing. The selected datasets collectively span IR values from 1.87 to 41.03, instance counts from 214 to 2,308, and feature dimensionalities from 5 to 19, providing a diverse and representative benchmark for assessing classifier robustness under varying degrees of class imbalance.
|
Dataset
|
Imbalance Ratio (IR)
|
Instances
|
Features
|
|
Mild imbalance (IR < 5)
|
|
|
|
|
pima
|
1.87
|
768
|
8
|
|
glass-0-1-2-3 vs 4-5-6
|
3.20
|
214
|
9
|
|
newthyroid2
|
5.14
|
215
|
5
|
|
newthyroid1
|
5.14
|
215
|
5
|
|
Moderate imbalance (5 ≤ IR < 15)
|
|
|
|
|
segment0
|
6.02
|
2,308
|
19
|
|
glass6
|
6.38
|
214
|
9
|
|
yeast-2 vs 4
|
9.08
|
514
|
8
|
|
page-blocks-1-3 vs 4
|
15.86
|
472
|
10
|
|
Severe imbalance (IR ≥ 15)
|
|
|
|
|
glass5
|
22.78
|
214
|
9
|
|
yeast4
|
28.10
|
1,484
|
8
|
|
yeast5
|
32.72
|
1,484
|
8
|
|
yeast6
|
41.03
|
1,484
|
8
|
Table 2. Comparative classification performance of KMFusionNet and six established boosting and ensemble methods across 12 benchmark imbalanced datasets, measured by mean area under the receiver operating characteristic curve (auROC). Values represent the mean auROC averaged over 10 independent experimental runs under 5-fold cross-validation on each dataset. All competing methods — AdaBoost, EUSBoost, Easy Ensemble, SMOTEBoost, RUSBoost, and DataBoost — used the C4.5 decision tree as the base learner; implementations were sourced from the KEEL software framework (Alcalá-Fdez et al., 2011). KMFusionNet employed alternating C4.5 Decision Tree and Extra Tree classifiers within the same AdaBoost architecture, augmented by a validation-guided early stopping criterion (stagnation window W = 10). Bold values indicate the highest auROC achieved for each dataset. auROC ranges from 0 to 1, with values closer to 1 indicating superior discriminative performance; a value of 0.5 corresponds to chance-level classification. Datasets are ordered by ascending imbalance ratio (IR).
|
Dataset
|
AdaBoost
|
EUSBoost
|
Easy Ensemble
|
SMOTE Boost
|
RUSBoost
|
DataBoost
|
KMFusionNet
|
|
pima
|
0.68
|
0.74
|
0.72
|
0.74
|
0.83
|
0.73
|
0.73
|
|
glass-0-1-2-3
|
0.88
|
0.92
|
0.93
|
0.92
|
0.95
|
0.94
|
0.99
|
|
newthyroid2
|
0.96
|
0.93
|
0.92
|
0.91
|
0.97
|
0.94
|
0.98
|
|
newthyroid1
|
0.94
|
0.95
|
0.95
|
0.97
|
0.99
|
0.96
|
0.98
|
|
segment0
|
0.97
|
0.97
|
0.97
|
0.99
|
0.99
|
0.99
|
0.99
|
|
glass6
|
0.84
|
0.90
|
0.89
|
0.83
|
0.88
|
0.89
|
0.99
|
|
yeast-2 vs 4
|
0.87
|
0.91
|
0.88
|
0.88
|
0.95
|
0.88
|
0.98
|
|
page-blocks-1-3 vs 4
|
0.92
|
0.97
|
0.92
|
0.96
|
0.98
|
0.95
|
0.99
|
|
glass5
|
0.96
|
0.98
|
0.97
|
0.97
|
0.96
|
0.97
|
0.99
|
|
yeast4
|
0.62
|
0.84
|
0.77
|
0.72
|
0.88
|
0.76
|
0.93
|
|
yeast5
|
0.82
|
0.95
|
0.93
|
0.95
|
0.97
|
0.86
|
0.99
|
|
yeast6
|
0.75
|
0.81
|
0.85
|
0.83
|
0.92
|
0.89
|
0.96
|
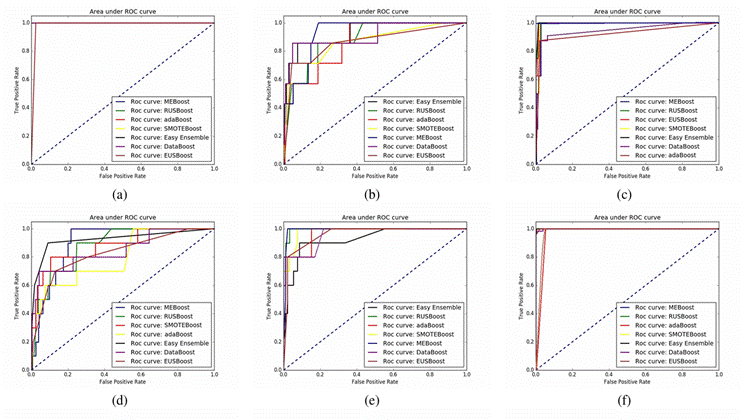
Figure 3. Receiver operating characteristic (ROC) curve analyses for KMFusionNet and competing methods on six representative high-imbalance benchmark datasets. Panels illustrate the trade-off between the True Positive Rate (TPR; sensitivity) and False Positive Rate (FPR; 1 − specificity) across all decision thresholds for: (a) glass5 (IR = 22.78), (b) yeast6 (IR = 41.03), (c) yeast5 (IR = 32.72), (d) yeast4 (IR = 28.1), (e) yeast-2 vs 4 (IR = 9.08), and (f) segment0 (IR = 6.02). These six datasets were selected to represent the range of moderate-to-severe imbalance conditions evaluated in this study. Curves closer to the upper-left corner of the ROC space indicate stronger discriminative performance. The diagonal dashed line (y = x) represents the random classification baseline (auROC = 0.5). Results represent the mean performance across 10 independent experimental runs. IR, imbalance ratio; TPR, true positive rate; FPR, false positive rate.
Table 3. Performance comparison of KMFusionNet against AdaBoost configured with four individual single base estimators across 12 benchmark imbalanced datasets, measured by mean auROC. This experiment was designed to isolate the contribution of the alternating dual-estimator strategy in KMFusionNet from the boosting mechanism itself. AdaBoost was applied independently with four single base learners — C4.5 Decision Tree, Extra Tree, Random Forest, and Support Vector Machine (SVM) — and results are compared against KMFusionNet, which alternates between C4.5 Decision Tree and Extra Tree classifiers. Values represent mean auROC over 10 independent runs under 5-fold cross-validation. Bold values denote the highest auROC for each dataset. All implementations used the KEEL framework (Alcalá-Fdez et al., 2011). Note: the table header "MEBoost" in the original manuscript refers to KMFusionNet and should be read as such throughout. Datasets are ordered by ascending imbalance ratio (IR). SVM, support vector machine; IR, imbalance ratio.
|
Dataset
|
Decision Tree
|
Extra Tree
|
Random Forest
|
SVM
|
KMFusionNet
|
|
pima
|
0.68
|
0.64
|
0.66
|
0.69
|
0.71
|
|
glass-0-1-2-3
|
0.89
|
0.97
|
0.98
|
0.96
|
0.98
|
|
newthyroid2
|
0.95
|
0.97
|
0.98
|
0.99
|
0.99
|
|
newthyroid1
|
0.94
|
0.98
|
0.99
|
0.99
|
0.99
|
|
segment0
|
0.96
|
0.99
|
0.99
|
0.99
|
0.99
|
|
glass6
|
0.84
|
0.97
|
0.93
|
0.93
|
0.99
|
|
yeast-2 vs 4
|
0.88
|
0.95
|
0.95
|
0.91
|
0.98
|
|
page-blocks-1-3 vs 4
|
0.92
|
0.96
|
0.98
|
0.98
|
0.99
|
|
glass5
|
0.97
|
0.97
|
0.95
|
0.93
|
0.99
|
|
yeast4
|
0.62
|
0.92
|
0.80
|
0.89
|
0.91
|
|
yeast5
|
0.81
|
0.97
|
0.98
|
0.99
|
0.99
|
|
yeast6
|
0.74
|
0.91
|
0.95
|
0.94
|
0.95
|
Yu, 2003; Yao et al., 2007). In this study, W was set to 10 based on standard practice from the early stopping literature (Jiang, 2004). At each iteration, the current ensemble is evaluated on a held-out validation set (comprising 5% of the total dataset, separated before cross-validation; see Section 2.6) using auROC as the performance criterion. The best ensemble configuration observed so far is retained. If no improvement in validation auROC is observed over W = 10 consecutive iterations, training terminates and the best-recorded ensemble is returned as the final model. This procedure follows the early stopping framework as described by Bühlmann and Yu (2003) and analyzed by Jiang (2004).
2.5 Full Algorithm (KMFusionNet)
The complete KMFusionNet procedure is as follows:
Input: Training set S with class labels, validation set V (5% holdout), stagnation window W = 10, maximum iterations T_max.
1. Initialize uniform sample weights D₁(i) = 1/n for all instances i = 1, ..., n.
2. Set best_auROC = 0, stagnation_count = 0, best_ensemble = ∅.
3. For t = 1, 2, ..., T_max:
a. Select learner hₜ: if t is odd, use C4.5 Decision Tree; if even, use Extra Tree.
b. Train hₜ on the weighted training set (S, Dₜ).
c. Compute weighted error εₜ = Σ Dₜ(i) · 𝟙[hₜ(xᵢ) ≠ yᵢ].
d. If εₜ ≥ 0.5, discard hₜ and continue.
e. Compute learner weight αₜ = 0.5 · ln((1 − εₜ)/εₜ).
f. Update instance weights: Dₜ₊₁(i) ∝ Dₜ(i) · exp(−αₜ · yᵢ · hₜ(xᵢ)), then normalize.
g. Add hₜ with weight αₜ to ensemble.
h. Evaluate ensemble on validation set V; record auROC_t.
i. If auROC_t > best_auROC: update best_auROC = auROC_t, best_ensemble = current ensemble, stagnation_count = 0.
j. Else: stagnation_count += 1. If stagnation_count ≥ W, terminate.
4. Return best_ensemble.
Algorithm 1: KMFusionNet
Input: Imbalanced dataset D, stagnation window size W Output: An ensemble model H
- Set t ← 0, score_best ← 0, nonImproving ← 0
- Initialize sample weights: wᵢᵗ ← 1/|D| for each xᵢ ∈ D
- while true do
- ⠀⠀Increment t ← t + 1
- ⠀⠀Select estimator tree type T (alternate between Decision Tree and Extra Tree)
- ⠀⠀Train weak learner h^(t) of type T on weighted dataset D
- ⠀⠀Compute error rate: error(h^(t)) = Σ wᵢᵗ · 𝟙[h^(t)(xᵢ) ≠ yᵢ]
- ⠀⠀if error(h^(t)) ≥ 0.5 then
- ⠀⠀⠀⠀Go back to step 4 (discard learner and retry)
- ⠀⠀end if
- ⠀⠀for each xᵢ ∈ D do
- ⠀⠀⠀⠀Update weights wᵢᵗ
- ⠀⠀end for
- ⠀⠀Compute learner weight: αₜ = ½ · logₑ((1 − error(h^(t))) / error(h^(t)))
- ⠀⠀Update meta-classifier: Hₜ = sign(Σᵢ₌₁ᵗ αᵢ · h^(i))
- ⠀⠀Evaluate: score = auROCscore(Hₜ, X_test, Y_test)
- ⠀⠀if score_top ≤ score then
- ⠀⠀⠀⠀score_best ← score
- ⠀⠀⠀⠀H_best ← Hₜ
- ⠀⠀end if
- ⠀⠀if score ≤ score_top then
- ⠀⠀⠀⠀nonImproving ← nonImproving + 1
- ⠀⠀⠀⠀if nonImproving = W then
- ⠀⠀⠀⠀⠀⠀H ← H_best
- ⠀⠀⠀⠀⠀⠀break
- ⠀⠀⠀⠀end if
- ⠀⠀end if
- end while
2.6 Experimental Setup
Datasets. Twelve benchmark datasets were selected from the KEEL dataset repository (Alcalá-Fdez et al., 2011) to cover a wide range of imbalance conditions. The selected datasets span imbalance ratios (IR) from 1.87 (pima) to 41.03 (yeast6), with instance counts ranging from 214 to 2,308 and feature dimensionalities from 5 to 19 (Table 1). This range was deliberately chosen to assess KMFusionNet's robustness across mild, moderate, and severe imbalance scenarios.
Data partitioning. For each dataset, 5% of instances were separated as a validation set before any training was performed. This validation set was used exclusively for the early stopping criterion described in Section 2.4 and was not accessible during training or cross-validation. The remaining 95% of each dataset was subjected to 5-fold cross-validation to generate training and test splits for performance evaluation.
Evaluation protocol. Classification performance was evaluated using the area under the receiver operating characteristic curve (auROC), consistent with established practice in imbalanced learning benchmarks (He & Garcia, 2009; Sun et al., 2009). The ROC curve plots the True Positive Rate (TPR = TP/(TP+FN)) against the False Positive Rate (FPR = FP/(FP+TN)) across all decision thresholds, where TP, TN, FP, and FN denote true positives, true negatives, false positives, and false negatives, respectively. auROC values range from 0 (perfect misclassification) to 1 (perfect classification), with 0.5 indicating chance-level performance. auROC is particularly suited to imbalanced evaluation because it is invariant to class distribution and decision threshold selection.
Each experiment was repeated across 10 independent runs with different random seeds, and mean auROC values are reported. Competitor implementations (AdaBoost, RUSBoost, SMOTEBoost, EUSBoost, DataBoost, Easy Ensemble) were sourced from the KEEL software framework (Alcalá-Fdez et al., 2011), with C4.5 used as the base learner for all competitors to ensure a fair comparison. For KMFusionNet's second set of comparisons (Table 3), the AdaBoost framework was applied with individual single base learners — Decision Tree, Extra Tree, Random Forest, and SVM (Cortes & Vapnik, 1995; Liaw & Wiener, 2002) — to isolate the contribution of the alternating estimator strategy from the boosting mechanism itself.