Data Modeling

Mathematical and Computational Data Modeling
1
Citations
6k
Views
37
Articles
Your new experience awaits. Try the new design now and help us make it even better
Switch to the new experience
Figures and Tables
RESEARCH ARTICLE   (Open Access)

Machine Learning–Driven Classification of Thyroid Disorders: An XGBoost-Based Approach for Improved Diagnostic Accuracy

Sayed Rokibul Hossain1*, Kamruzzaman Mithu 1, Md. Nesar Uddin1, Md. Ataur Rahman1, Khondaker Abdullah Al Mamun1

+ Author Affiliations

Data Modeling 5 (1) 1-13 https://doi.org/10.25163/data.5110753

Submitted: 10 June 2024 Revised: 13 August 2024  Published: 14 August 2024 


Abstract

Thyroid disorders, though often clinically manageable, remain surprisingly difficult to diagnose in their early stages, largely due to overlapping and nonspecific symptoms. This diagnostic ambiguity, combined with subtle variations in biochemical markers, has created a growing need for more reliable and data-driven approaches. In this context, machine learning techniques have begun to offer a promising pathway—though their practical effectiveness, particularly under conditions of data imbalance and variability, still requires careful evaluation. This study explores the application of a machine learning framework for the classification of thyroid disease into three clinically relevant categories: hyperthyroidism, hypothyroidism, and normal function. Using the publicly available UCI thyroid dataset, a structured preprocessing pipeline was implemented, including feature selection, handling of missing values, and exploratory data analysis to understand underlying patterns. Among several potential models, Extreme Gradient Boosting (XGBoost) was selected due to its robustness in handling missing data and imbalanced class distributions. The model was evaluated across multiple configurations, including baseline, optimized, and imbalance-aware approaches. The results, at first glance, appear highly promising, with classification accuracy reaching approximately 99% and balanced accuracy improving to around 94% in optimized settings. Feature importance analysis further revealed that key hormonal indicators—such as TSH, TT4, and FTI—play a dominant role in prediction, aligning with established clinical understanding. Despite these encouraging findings, it is important to approach the results with measured caution. The controlled nature of the dataset may not fully reflect real-world clinical variability. Nevertheless, the study underscores the potential of machine learning as a supportive diagnostic tool, offering a step toward more efficient and data-informed clinical decision-making.

Keywords: Thyroid disease; Machine learning; XGBoost; Clinical prediction; Class imbalance

1. Introduction

The thyroid gland, though relatively small in size, plays a remarkably expansive role in maintaining physiological balance across the human body. Situated anterior to the trachea, this highly vascular endocrine organ regulates metabolic processes through the secretion of key hormones—primarily triiodothyronine (T3) and thyroxine (T4)—alongside calcitonin, a peptide involved in calcium homeostasis (Ashman & Molina, 2013; Hammer & McPhee, 2018). These hormones influence a wide array of biological functions, from cellular metabolism and thermoregulation to growth and neurological development. In fact, even subtle disruptions in thyroid hormone levels can cascade into systemic effects, sometimes quietly at first, before manifesting as clinically significant disorders.

Thyroid diseases, broadly categorized into conditions such as hyperthyroidism, hypothyroidism, goiter, nodular abnormalities, and subclinical dysfunctions, remain a persistent challenge in clinical practice (de Morais et al., 2019; Taylor et al., 2018). What complicates matters further—perhaps more than we initially anticipate—is the nonspecific nature of their symptoms. Fatigue, weight fluctuations, mood disturbances, and sleep irregularities often overlap with a range of other conditions, making early and accurate diagnosis particularly elusive. As Boelaert et al. (2020) suggest, even mildly abnormal thyroid test results can present interpretive ambiguity, especially in pediatric and borderline cases. Consequently, delays in diagnosis are not uncommon, and these delays can lead to progressive complications affecting cardiovascular, neurological, and metabolic systems.

Epidemiologically, the burden of thyroid disease is far from negligible. In the United States alone, an estimated 20 million individuals are affected by some form of thyroid disorder, with autoimmune conditions being the most prevalent (Atasayar & Demir, 2019). On a global scale, iodine deficiency continues to drive hypothyroidism and goiter in many regions, highlighting a complex interplay between environmental, nutritional, and genetic factors (Taylor et al., 2018). Given this widespread prevalence, there is an increasing need—not only for accurate diagnostic tools—but for systems that can assist clinicians in navigating the inherent complexity of thyroid function data.

Traditionally, the diagnosis of thyroid disorders relies on biochemical assays, imaging techniques, and clinical examination. While these methods are indispensable, they are not without limitations. Laboratory values, for instance, often exhibit subtle variations within “normal” ranges, and interpreting these variations requires both experience and contextual understanding (Gyuricsko, 2020). Moreover, the growing volume of patient data—spanning laboratory results, demographic variables, and clinical histories—can overwhelm conventional analytical approaches. It is here that computational techniques, particularly those rooted in machine learning, begin to offer a compelling alternative.

Over the past decade, machine learning (ML) has emerged as a promising tool in medical diagnostics, capable of uncovering patterns that may not be immediately apparent through traditional analysis. By leveraging historical patient data, ML models can assist in early detection, risk stratification, and even predictive diagnostics across a variety of diseases (Razia et al., 2020). In the context of thyroid disease, several studies have explored the application of algorithms such as Support Vector Machines (SVM), K-Nearest Neighbors (KNN), Random Forests (RF), and ensemble methods, often reporting high classification accuracies (Pan et al., 2016; Duggal & Shukla, 2020; Asif et al., 2020). Yet, despite these advances, there remains a need for approaches that not only achieve high predictive performance but also effectively handle challenges such as class imbalance, missing data, and feature redundancy—issues that are quite typical in clinical datasets.

In this regard, gradient boosting frameworks, particularly Extreme Gradient Boosting (XGBoost), have gained attention for their robustness and efficiency. XGBoost is designed to optimize predictive accuracy through ensemble learning while incorporating regularization techniques to mitigate overfitting. Its ability to handle missing values and imbalanced datasets—arguably two of the more persistent challenges in healthcare data—makes it especially suitable for thyroid disease classification tasks. Still, the effectiveness of such models depends heavily on thoughtful data preprocessing, feature selection, and careful evaluation.

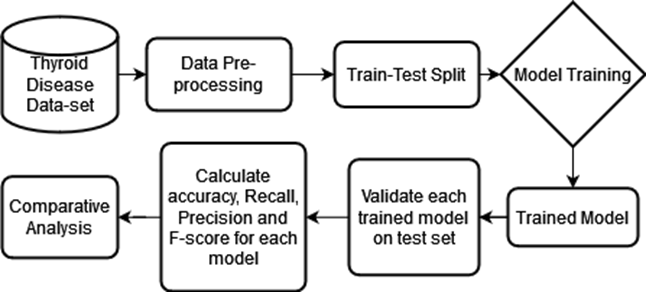
Against this backdrop, the present study seeks to develop a machine learning-based framework for the classification of thyroid disease into three clinically relevant categories: hyperthyroidism, hypothyroidism, and normal function. Using the widely recognized UCI thyroid dataset, this work integrates preprocessing strategies, exploratory data analysis, and an XGBoost-based classification model to assess predictive performance (Fig. 1). While the dataset itself is not new, the study attempts to bring together methodological clarity and practical considerations, particularly in handling data imbalance and feature relevance, in a way that aligns with real-world diagnostic challenges.

Ultimately, this work does not claim to replace clinical judgment—nor should it. Rather, it contributes to a growing body of research that seeks to augment medical decision-making with data-driven insights. If anything, it reflects a broader shift in healthcare: one where computational tools, when carefully applied, may help bridge the gap between complex data and timely, accurate diagnosis.
2. Methods

2.1 Study Design and Data Source

This study adopted a retrospective, data-driven experimental design aimed at evaluating the performance of machine learning models in the classification of thyroid disorders. The dataset utilized was obtained from the UCI Machine Learning Repository, a widely recognized and publicly accessible source frequently employed in benchmarking clinical prediction models. The choice of this dataset was, in part, pragmatic—it allows for comparability with prior studies while offering a sufficiently rich set of biochemical and demographic variables relevant to thyroid function analysis (Asif et al., 2020).

The dataset comprises patient-level records containing laboratory measurements, demographic attributes, and diagnostic labels. For the purpose of this study, the target variable was redefined into three clinically meaningful categories: hyperthyroidism, hypothyroidism, and normal thyroid function. This grouping was performed to reflect a simplified yet clinically interpretable diagnostic framework, consistent with prior work in thyroid disease classification (Pan et al., 2016; Duggal & Shukla, 2020).

2.2 Feature Selection and Variable Description

A subset of clinically relevant biochemical markers was selected based on their established role in thyroid function assessment. These included:

  • Thyroid Stimulating Hormone (TSH)
  • Triiodothyronine (T3)
  • Total Thyroxine (TT4)
  • T4 Uptake (T4U)
  • Free Thyroxine Index (FTI)

These variables are routinely used in clinical endocrinology and have demonstrated predictive value in distinguishing thyroid dysfunction states (Hammer & McPhee, 2018). Reference ranges for these parameters were considered during exploratory analysis to contextualize observed distributions (Table 1).

In addition to biochemical features, demographic variables such as age and sex were included where available. However, several attributes—such as “TSH measured,” “T3 measured,” and other Boolean indicators—were removed due to redundancy, as they merely indicated the presence or absence of corresponding test values rather than contributing meaningful information to the predictive model.

2.3 Data Preprocessing

Data preprocessing was conducted in several stages, each intended to address common challenges associated with clinical datasets—namely missing values, redundant features, and class imbalance.

2.3.1 Handling Missing Data

An initial assessment of missingness was performed by calculating the proportion of null values for each feature. Variables with excessive missingness—most notably the “TBG” attribute—were excluded from further analysis. For the remaining dataset, records with missing target labels were removed to ensure the integrity of supervised learning.

It is worth noting that, rather than imputing missing values across all features, we leveraged the inherent capability of the XGBoost algorithm to handle missing data during training. This approach, while somewhat unconventional, has been shown to be effective in maintaining model performance without introducing imputation bias (Chen & Guestrin, 2016).

2.3.2 Data Cleaning and Transformation

Categorical variables were encoded into numerical representations to facilitate model training. Specifically:

  • Binary attributes were mapped to 0 and 1
  • Sex was encoded as 0 (male) and 1 (female)

Additionally, minor inconsistencies in demographic data were corrected. For instance, records indicating pregnancy with missing sex values were logically assigned as female, reflecting biological plausibility.

2.3.3  Outlier Analysis

Table 1. Determining factors and reference ranges for thyroid-related biochemical parameters. This table summarizes the key biochemical attributes used in the study, including Thyroid Stimulating Hormone (TSH), Triiodothyronine (T3), Total Thyroxine (TT4), T4 uptake (T4U), and Free Thyroxine Index (FTI), along with their clinically accepted reference ranges. These parameters form the core input features for the machine learning model, reflecting standard diagnostic indicators used in thyroid function assessment

#

Attribute

Elaboration

Domain

1

TSH

Thyroid Stimulating Hormone

0.4 to 5.0 milli-IU

2

T3

Triiodothyronine

100 to 200 ng/dL

3

TT4

Total T4 (Thyroxine)

4.6 to 12 mg/dL

4

T4U

T4 uptake

0.7 to 1.9 ng/dL

5

FTI

Free T4 Index

4 to 11 ng/dL

Fig. 1. Overview of the proposed machine learning workflow for thyroid disease classification. This figure illustrates the overall methodological pipeline adopted in the study, beginning with raw data acquisition, followed by preprocessing steps such as feature selection and cleaning, exploratory data analysis, and finally classification using the XGBoost algorithm. The workflow reflects a structured approach to transforming clinical data into predictive insights .

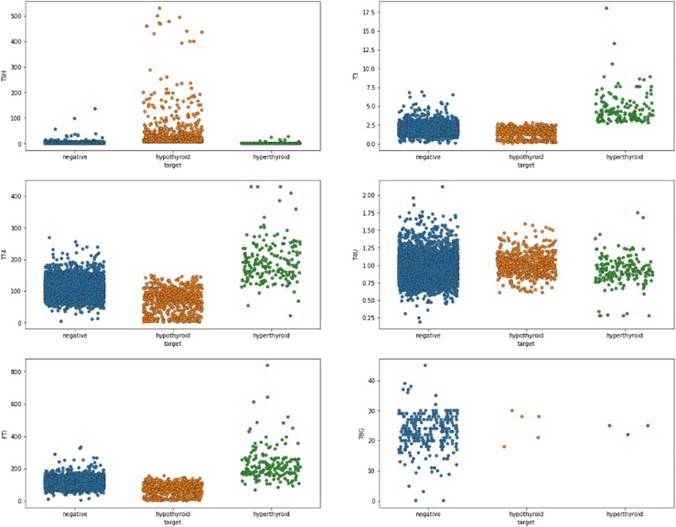
Fig. 2. Distribution of numerical attributes across thyroid disease classes. This figure presents the distribution of key hormonal features (e.g., TSH, T3, TT4, FTI) stratified by diagnostic categories (normal, hyperthyroid, hypothyroid). The visualization highlights potential separability among classes and provides an initial indication of feature relevance for classification tasks.

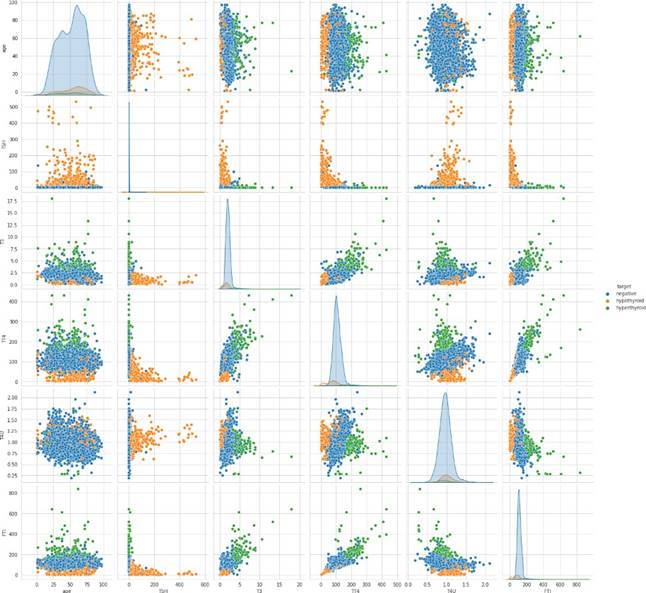
Fig. 3. Pairwise relationship analysis of numerical features using pair plots. This figure shows pairwise scatter plots and marginal distributions of numerical variables, allowing visualization of inter-feature relationships and clustering patterns among diagnostic classes. Notably, distinct groupings can be observed in combinations such as FTI vs. T3 and TT4 vs. T4U, suggesting their discriminative potential. The figure also reflects the inherent class imbalance in the dataset.

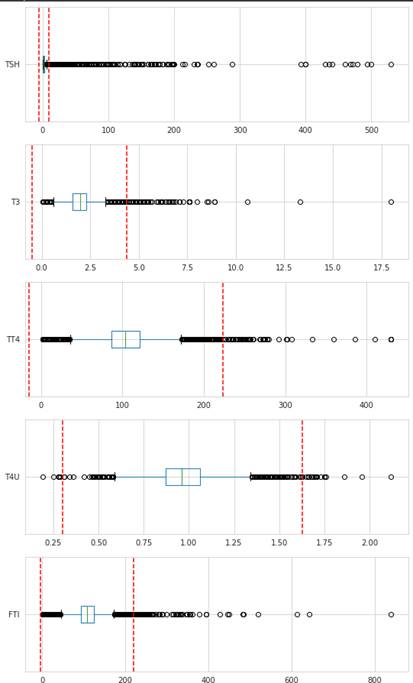
Outliers were examined using box plots and distributional analysis (Fig. 4). While several extreme values were observed—particularly in hormone levels—it became apparent that these variations were not necessarily erroneous. Rather, they likely reflected genuine physiological deviations associated with disease states. Consequently, outliers were retained to preserve the clinical realism of the dataset (Gyuricsko, 2020).

2.3.4 Feature Scaling

Although tree-based models such as XGBoost are generally insensitive to feature scaling, normalization was explored during preliminary analysis to ensure consistency across features. However, scaling was ultimately not applied in the final model, as it did not yield a measurable improvement in performance.

2.3.5 Exploratory Data Analysis (EDA)

Exploratory analysis was conducted to better understand the relationships between input variables and diagnostic classes. Distribution plots revealed noticeable separation between classes for certain features—particularly FTI, T3, and TT4—suggesting their strong predictive potential (Fig. 2).

Pairwise scatter plots further indicated the presence of clustering patterns among variables such as FTI vs. T3 and TT4 vs. T4U (Fig. 3). At the same time, a pronounced class imbalance was observed, with the “normal” category significantly outnumbering the disease classes. This imbalance, if left unaddressed, could bias model performance toward the majority class (Asif et al., 2020).

2.4 Model Development

2.4.1 Algorithm Selection

The primary classification model employed in this study was Extreme Gradient Boosting (XGBoost), an ensemble learning algorithm based on gradient boosting principles. XGBoost constructs a series of decision trees sequentially, where each subsequent tree aims to minimize the residual error of the previous ensemble (Chen & Guestrin, 2016).

The selection of XGBoost was guided by several practical considerations:

  • Its robustness to missing values
  • Its ability to handle non-linear relationships
  • Its effectiveness in imbalanced classification tasks
  • Built-in feature importance estimation

These characteristics make it particularly suitable for medical datasets, which often exhibit complexity and irregularity.

2.5 Model Training and Evaluation

2.5.1 Data Splitting

The dataset was partitioned into training and testing subsets using an 80:20 split. The training set was used to fit the model, while the testing set was reserved for performance evaluation. To ensure reproducibility, a fixed random seed was applied during the splitting process.

2.5.2 Hyperparameter Configuration

Three experimental runs were conducted:

  1. Baseline Model: Default hyperparameters
  2. Optimized Model: Tuned hyperparameters (e.g., learning rate, max depth, number of estimators)
  3. Imbalance-Aware Model: Optimized parameters with class weighting applied

Hyperparameter tuning was performed iteratively, guided by performance metrics on the validation set.

2.5.3 Evaluation Metrics

Model performance was assessed using multiple metrics to provide a comprehensive evaluation:

  • Accuracy
  • Precision
  • Recall
  • F1-score
  • Balanced Accuracy

Confusion matrices were also generated to visualize classification performance across classes. Given the presence of class imbalance, particular emphasis was placed on macro-averaged metrics, which treat all classes equally.

2.5.4 Feature Importance Analysis

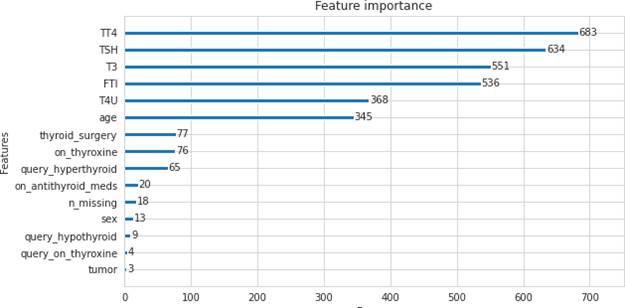
To interpret the model, feature importance scores were extracted from the trained XGBoost model. These scores reflect the contribution of each feature to the decision-making process. Features such as TT4, TSH, and FTI emerged as dominant predictors, aligning with clinical expectations regarding thyroid function biomarkers.

2.5.5 Reproducibility and Implementation

All analyses were conducted using Python, with libraries including:

  • Pandas for data manipulation
  • NumPy for numerical operations
  • Scikit-learn for preprocessing and evaluation
  • XGBoost for model development

The workflow—from data preprocessing to model evaluation—was executed in a sequential and modular manner to facilitate reproducibility. While the dataset is publicly available, careful documentation of preprocessing steps and parameter settings ensures that the results can be independently verified and extended in future studies.

3. Results

3.1 Model Performance Overview

The performance of the proposed classification framework was evaluated across three experimental configurations, each progressively refining the modeling strategy. At first glance, the results appear—perhaps surprisingly—quite strong, with overall classification accuracy approaching 99% across all runs. While such performance is certainly encouraging, it also warrants a more careful and somewhat cautious interpretation, particularly given the known characteristics of the dataset.

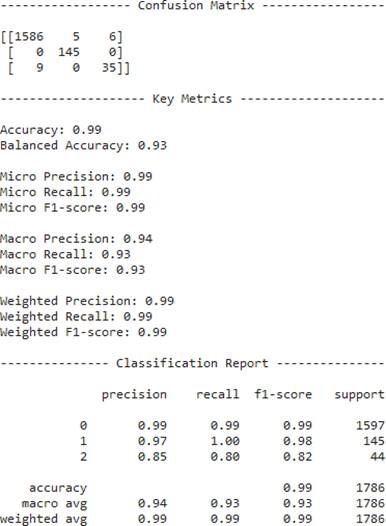
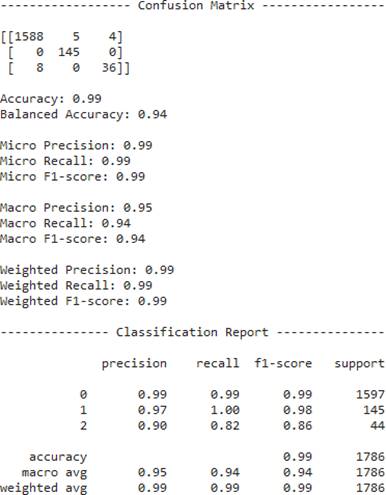
In the baseline model, where default hyperparameters of the XGBoost algorithm were applied, the model achieved an accuracy of approximately 0.99, with a balanced accuracy of 0.93 (Fig. 5). Precision, recall, and F1-scores were consistently high across the majority class, though slight variations began to emerge when examining minority classes. This pattern, while subtle, hinted at the underlying class imbalance already observed during exploratory data analysis.

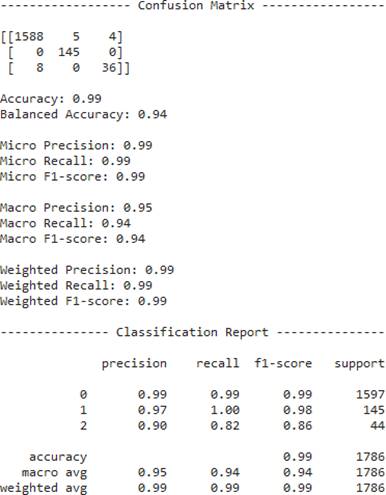
Following this, the second experimental run, which incorporated optimized hyperparameters, demonstrated marginal but consistent improvements in performance metrics. The balanced accuracy increased to approximately 0.94, and macro-averaged precision and recall also showed slight gains (Fig. 6). Interestingly, the improvement was not dramatic, suggesting that the baseline configuration of XGBoost was already reasonably well-suited to the dataset. Still, even small gains in balanced metrics can be meaningful, especially in clinical contexts where minority class prediction is critical.

In the third configuration, additional steps were taken to address class imbalance, which had been identified earlier as a potentially confounding factor. With the integration of class-weight adjustments, the model maintained its high overall accuracy while improving sensitivity toward underrepresented classes (Fig. 7). The macro F1-score, in particular, showed a modest but noteworthy increase, indicating a more equitable classification across categories.

3.2 Class-Level Performance Analysis

A closer inspection of the confusion matrices across the three runs (Fig. 5–7) reveals a more nuanced picture of model behavior. The majority class—representing normal thyroid function—was classified with near-perfect accuracy in all configurations. This is not entirely unexpected, given its dominance within the dataset.

However, for the minority classes, particularly hypothyroidism and hyperthyroidism, the classification performance showed slight inconsistencies. For instance, in the baseline model, a small number of misclassifications were observed, particularly between the disease categories themselves. This suggests that, while the model is highly effective at distinguishing normal from abnormal cases, differentiating between types of thyroid dysfunction remains somewhat more challenging.

By the third run, these misclassifications were reduced, though not entirely eliminated. The recall for the minority classes improved slightly, reflecting the impact of imbalance-aware adjustments. Still, it is worth noting that the support (i.e., number of instances) for these classes remained relatively low, which inherently limits the stability of performance metrics.

3.3 Feature Importance and Model Interpretability

One of the more insightful aspects of the model lies in its ability to provide feature importance scores (Fig. 8). These scores offer a glimpse into which variables most strongly influenced the classification process.

Among the features, TT4, TSH, and FTI emerged as the

Fig. 4. Box plot analysis of feature distributions and outlier detection. This figure illustrates the spread and variability of numerical features, highlighting the presence of outliers across different attributes. While some extreme values are evident, they are retained as they likely represent clinically meaningful variations rather than noise, particularly in pathological conditions.

Fig. 5. Performance evaluation of the baseline XGBoost model with default hyperparameters. This figure presents the classification performance of the initial model configuration, including metrics such as accuracy, precision, recall, and F1-score, along with the confusion matrix. The results provide a baseline reference for subsequent model improvements.

Fig. 6. Performance evaluation of the optimized XGBoost model. This figure illustrates the performance metrics obtained after tuning model hyperparameters. Improvements in balanced accuracy and class-wise performance are observed compared to the baseline model, indicating the impact of parameter optimization.

most influential predictors. This finding aligns well with established clinical understanding, where these biomarkers are routinely used to assess thyroid function (Hammer & McPhee, 2018). The prominence of these variables lends a degree of interpretability—and perhaps even credibility—to the model’s decisions.

Other features, such as T3 and demographic variables, contributed to a lesser extent. While their influence was not negligible, it appeared secondary compared to the primary hormonal indicators. This hierarchy of importance suggests that the model is, in a sense, learning patterns that are consistent with clinical reasoning, rather than relying on spurious correlations.

3.4 Decision Structure and Model Behavior

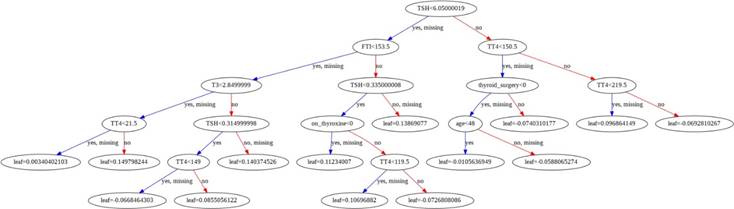
The structure of the trained model, visualized through the decision tree representation (Fig. 9), provides further insight into how classification decisions are made. At a glance, the model appears to rely on hierarchical splits primarily driven by key biochemical thresholds.

What is particularly interesting—though perhaps not entirely surprising—is that the decision boundaries are not overly complex. Instead, they reflect a series of logical conditions that mirror clinical diagnostic pathways. This relative simplicity may partly explain the model’s strong performance, as well as its generalizability within the dataset.

4. Discussion

4.1 Interpretation of High Accuracy

The exceptionally high accuracy observed across all experimental runs—approaching 99%—initially suggests that the proposed model is highly effective. However, such performance must be interpreted with a degree of caution. Datasets from the UCI repository, while valuable for benchmarking, are often well-structured and may not fully capture the variability and noise present in real-world clinical data.

It is therefore possible that the model is benefiting, at least in part, from the relative cleanliness and separability of the dataset. This raises the question of whether similar performance would be observed in more heterogeneous, real-world patient populations. Previous studies using similar datasets have reported comparably high accuracies, particularly when employing ensemble methods such as Random Forest and XGBoost (Pan et al., 2016; Asif et al., 2020), which lends some support to the findings, though does not entirely resolve this concern.

4.2 Impact of Class Imbalance

The issue of class imbalance, identified during exploratory analysis, plays a subtle yet important role in shaping model performance. As observed in earlier sections, the dataset contains a disproportionately large number of normal cases compared to disease categories.

Without appropriate handling, such imbalance can lead to models that appear highly accurate while performing poorly on minority classes. The improvements observed in the third experimental run—particularly in macro-averaged metrics—suggest that incorporating imbalance-aware strategies does, indeed, enhance model fairness.

That said, the improvements were modest rather than transformative. This may indicate that XGBoost’s inherent handling of imbalance, combined with the dataset’s structure, already mitigates some of the associated risks.

4.3 Comparison with Existing Studies

When compared with prior work, the results of this study are broadly consistent with the literature. For instance, Asif et al. (2020) reported classification accuracies exceeding 97% using ensemble learning techniques, while Pan et al. (2016) achieved similar performance with Random Forest-based models.

The present study’s results fall within this range, reinforcing the notion that machine learning models—particularly ensemble methods—are well-suited to thyroid disease classification tasks. However, it is important to recognize that many of these studies, including the current one, rely on the same or similar datasets. As such, the incremental novelty of performance improvements may be limited.

4.4 Clinical Relevance and Practical Implications

From a clinical perspective, the ability to accurately classify thyroid disorders using machine learning holds considerable promise. Early detection, particularly in cases where symptoms are ambiguous or nonspecific, could significantly improve patient outcomes.

At the same time, it is important to acknowledge that such models are not intended to replace clinical judgment. Rather, they should be viewed as decision-support tools—capable of augmenting, but not substituting,

Fig. 7. Performance evaluation of the imbalance-aware XGBoost model. This figure shows the classification results after incorporating strategies to address class imbalance. Enhanced sensitivity toward minority classes is observed, as reflected in improved recall and macro-averaged metrics.

Fig. 8. Feature importance ranking derived from the XGBoost model. This figure displays the relative importance of input features in the classification process. Key hormonal variables such as TT4, TSH, and FTI are identified as dominant contributors, aligning with their established clinical significance in thyroid function evaluation.

Fig. 9. Representative decision tree structure from the XGBoost model. This figure provides a visualization of one of the decision trees within the XGBoost ensemble, illustrating how feature thresholds are used to partition the data and make classification decisions. The structure reflects the hierarchical logic underlying the model’s predictions.

physician expertise. The interpretability of the model, particularly through feature importance analysis, enhances its potential usability in clinical settings.

4.5 Limitations

Despite its strengths, this study is not without limitations. The reliance on a single, publicly available dataset restricts the generalizability of the findings. Additionally, the absence of external validation limits confidence in the model’s performance beyond the dataset used.

Furthermore, while the model demonstrates strong predictive capability, it does not incorporate longitudinal patient data or clinical context, both of which are critical in real-world diagnosis.

4.6 Future Directions

Future research could explore the integration of additional data sources, including electronic health records and imaging data, to enhance model robustness. The application of deep learning techniques, as well as hybrid models combining statistical and machine learning approaches, may also offer promising avenues for improvement.

Perhaps more importantly, validation on real-world clinical datasets will be essential to determine the true utility of such models in practice.

5. Conclusion

In reflecting on the findings, it becomes increasingly clear that machine learning—particularly ensemble approaches like XGBoost—can offer a surprisingly effective framework for thyroid disease classification. The model demonstrated consistently high performance across multiple configurations, suggesting that even relatively structured clinical datasets can yield meaningful predictive insights when approached thoughtfully.

That said, the results should perhaps be interpreted with a degree of restraint. The dataset, while widely used, does not fully capture the complexity and variability of real-world clinical environments. As such, the observed accuracy—though impressive—may not translate directly into practice without further validation.

Still, the broader implication remains compelling. When carefully implemented, machine learning models can serve as valuable adjuncts to clinical reasoning, helping to navigate diagnostic uncertainty with greater precision. Future work, ideally involving more diverse datasets and external validation, will be essential in determining how far this potential can be realized in practical healthcare settings.

Author Contribution

S.R.H. conceived and designed the study, performed data preprocessing and feature selection, implemented and evaluated the XGBoost model across baseline, optimized, and imbalance-aware configurations, analyzed the results, and drafted the manuscript. K.M. contributed to exploratory data analysis and model evaluation. M.N.U. contributed to data curation and preprocessing. M.A.R. contributed to feature importance analysis and interpretation of clinical relevance. K.A.A.M. supervised the study, provided critical guidance on methodology, and critically reviewed and revised the manuscript. All authors read and approved the final manuscript.

Acknowledgement

The authors S.R.H. et al., would like to thank the UCI Machine Learning Repository for providing public access to the thyroid dataset used in this study. The authors also acknowledge the institutional support that facilitated this work.

Competing Financial Interests

The authors S.R.H. et al., declare no competing financial interests.

References


Ashman, R., & Molina, P. E. (2013). Endocrine physiology (4th ed.). McGraw-Hill Medical.

Asif, M. A. A. R., Nishat, M. M., Faisal, F., Shikder, M. F., Udoy, M. H., Dip, R. R., & Ahsan, R. (2020). Computer-aided diagnosis of thyroid disease using machine learning algorithms. In Proceedings of the International Conference on Electrical and Computer Engineering (pp. 222–225).

Atasayar, S., & Demir, S. G. (2019). Determination of the problems experienced by patients post-thyroidectomy. Clinical Nursing Research, 28(5), 615–635.

Boelaert, K., Visser, W. E., Taylor, P. N., Moran, C., Léger, J., & Persani, L. (2020). Endocrinology in the time of COVID-19: Management of hyperthyroidism and hypothyroidism. European Journal of Endocrinology, 183(1), G33–G39.

Chaubey, G., Bisen, D., Arjaria, S., & Yadav, V. (2021). Thyroid disease prediction using machine learning approaches. National Academy Science Letters, 44(3), 233–238.

de Morais, N. S., Stuart, J., Guan, H., Wang, Z., Cibas, E. S., Frates, M. C., Benson, C. B., Cho, N. L., Nehs, M. A., Alexander, C. A., Marqusee, E., Kim, M. I., Lorch, J. H., Barletta, J. A., Angell, T. E., & Alexander, E. K. (2019). The impact of Hashimoto thyroiditis on thyroid nodule cytology and risk of thyroid cancer. Journal of the Endocrine Society, 3(4), 791–800.

Duggal, P., & Shukla, S. (2020). Prediction of thyroid disorders using advanced machine learning techniques. In Proceedings of the International Conference on Cloud Computing, Data Science & Engineering (pp. 670–675).

Gyuricsko, E. (2020). The “slightly” abnormal thyroid test: What is the pediatrician to do? Current Problems in Pediatric and Adolescent Health Care, 50(4), 100770.

Hammer, G. D., & McPhee, S. J. (2018). Pathophysiology of disease: An introduction to clinical medicine (8th ed.). McGraw-Hill Medical.

Pan, Q., Zhang, Y., Zuo, M., Xiang, L., & Chen, D. (2016). Improved ensemble classification method of thyroid disease based on random forest. In Proceedings of the International Conference on Information Technology in Medicine and Education (pp. 567–571).

Razia, S., Kumar, P. S., & Rao, A. S. (2020). Modern approaches in machine learning and cognitive science: A walkthrough. In V. K. Gunjan, J. M. Zurada, B. Raman, & G. R. Gangadharan (Eds.), Advances in intelligent systems and computing (Vol. 885). Springer.

Saiti, F., Naini, A. A., Shoorehdeli, M. A., & Teshnehlab, M. (2009). Thyroid disease diagnosis based on genetic algorithms using probabilistic neural network and support vector machine. In Proceedings of the International Conference on Bioinformatics and Biomedical Engineering (pp. 1–4).

Taylor, P. N., Albrecht, D., Scholz, A., Gutierrez-Buey, G., Lazarus, J. H., Dayan, C. M., & Okosieme, O. E. (2018). Global epidemiology of hyperthyroidism and hypothyroidism. Nature Reviews Endocrinology, 14(5), 301–316.

Temurtas, F. (2009). A comparative study on thyroid disease diagnosis using neural networks. Expert Systems with Applications, 36(1), 944–949.


Article metrics
View details
0
Downloads
0
Citations
367
Views
📖 Cite article

View Dimensions


View Plumx


View Altmetric


0
Save
0
Citation
367
View
0
Share